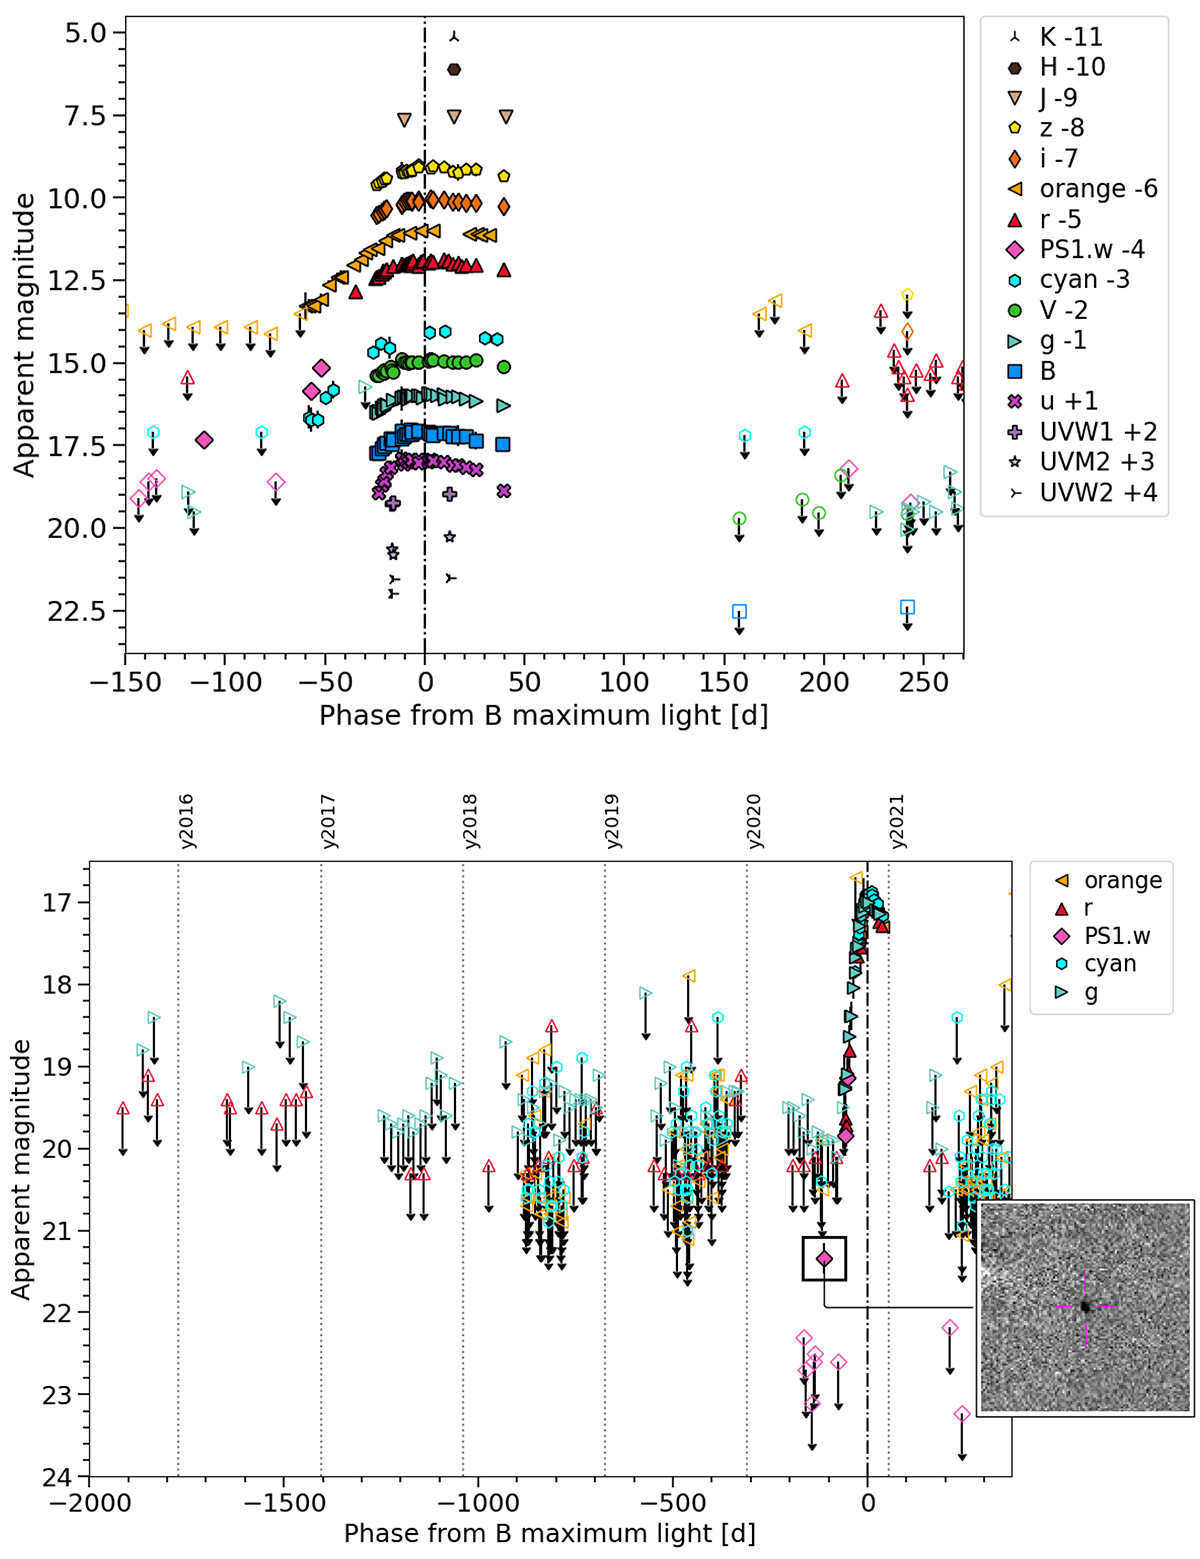
Fig. 2.
Download original image
Light curves of SN 2020pvb. Top: UV-optical-NIR light curves of SN 2020pvb. Upper limits are indicated by empty symbols with arrows. Bottom: Historical light curves of SN 2020pvb. Upper limits are indicated by empty symbols with arrows. The light curves have been shifted for clarity by the amounts indicated in the legend. The right insert is a 27″ × 27″ zoomed-in view of the transient position in the difference image (observation minus reference image) taken on 2020 July 18 in the PS1 w band. The precursor outburst is detected at a greater than 5-sigma significance.
Current usage metrics show cumulative count of Article Views (full-text article views including HTML views, PDF and ePub downloads, according to the available data) and Abstracts Views on Vision4Press platform.
Data correspond to usage on the plateform after 2015. The current usage metrics is available 48-96 hours after online publication and is updated daily on week days.
Initial download of the metrics may take a while.