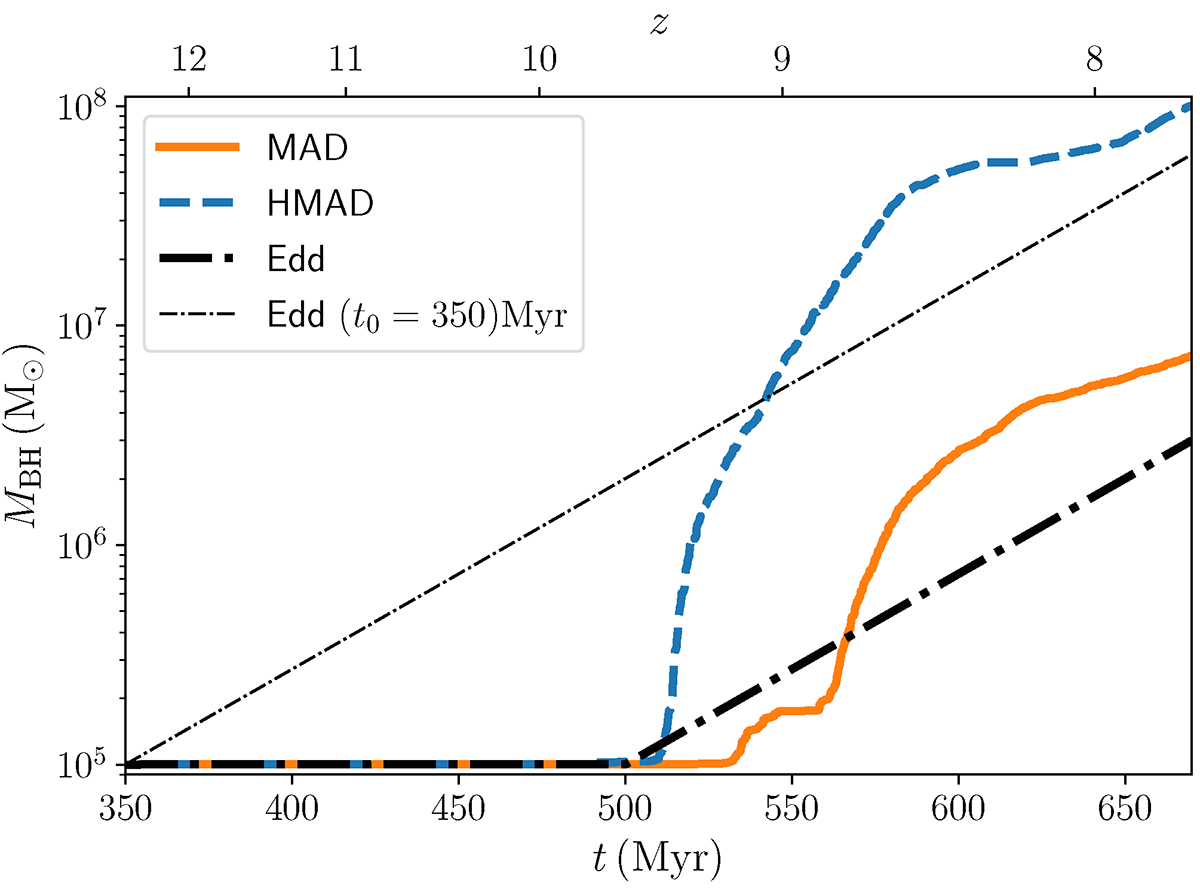
Fig. 2.
Download original image
Evolution of the MBH mass in the MAD (shown as a solid orange line) and HMAD (shown as a dashed blue line) simulations. For comparison, we also show two dot-dashed black lines corresponding to the MBH growth for a constant Eddington accretion. The thick line starts at t = 500 Myr (consistent with the HMAD case), and the thin line starts at t = 350 Myr, immediately after seeding.
Current usage metrics show cumulative count of Article Views (full-text article views including HTML views, PDF and ePub downloads, according to the available data) and Abstracts Views on Vision4Press platform.
Data correspond to usage on the plateform after 2015. The current usage metrics is available 48-96 hours after online publication and is updated daily on week days.
Initial download of the metrics may take a while.