Fig. 2.

Download original image
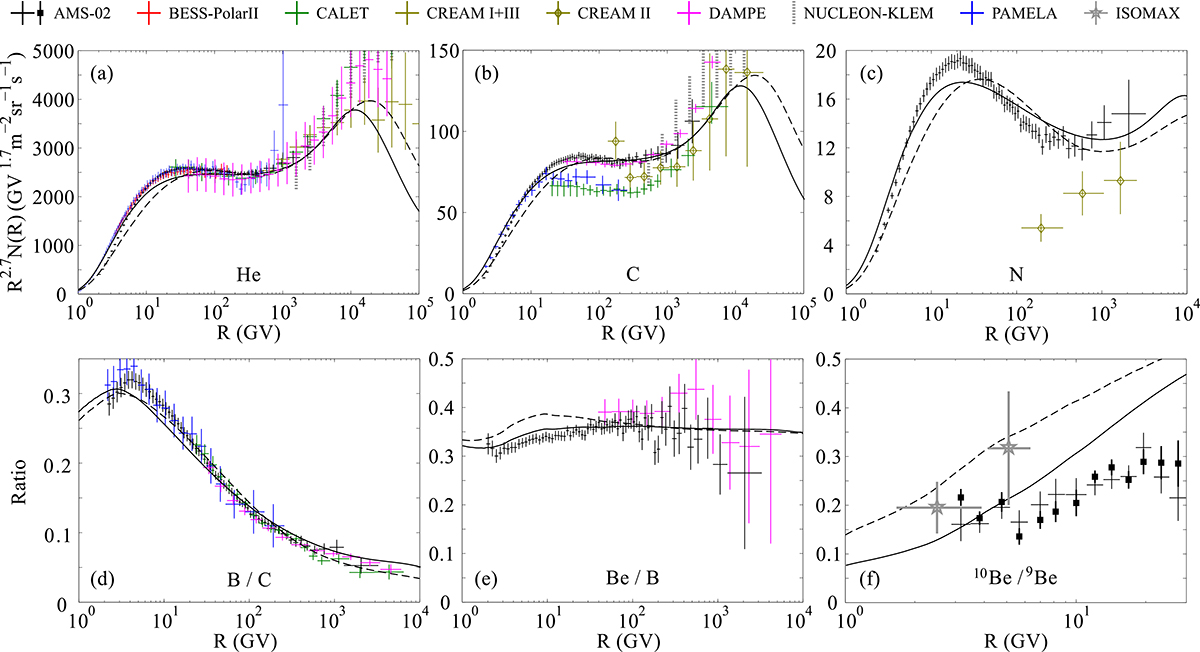
Spectra of nuclei and their ratios versus rigidity. Top panels: spectra of primary CR nuclei of helium (a), carbon (b), and nitrogen (c). Bottom panels: abundance ratios of stable secondary to primary nuclei, represented by the boron-to-carbon ratio (d), as well as of unstable to stable secondary nuclei, represented by the beryllium-to-boron (e) and the beryllium-10-to-beryllium-9 (f) ratios. Our numerical results without and with taking into account the ion-neutral damping are plotted, respectively, by the dashed and solid lines. The symbols depict the observational data: preliminary AMS-02 data for the 10Be/9Be ratio (Derome & Paniccia 2021) and their recent update (Wei 2023) are represented in the bottom right panel by the black crosses and squares, respectively.
Current usage metrics show cumulative count of Article Views (full-text article views including HTML views, PDF and ePub downloads, according to the available data) and Abstracts Views on Vision4Press platform.
Data correspond to usage on the plateform after 2015. The current usage metrics is available 48-96 hours after online publication and is updated daily on week days.
Initial download of the metrics may take a while.


