Fig. 9
Download original image
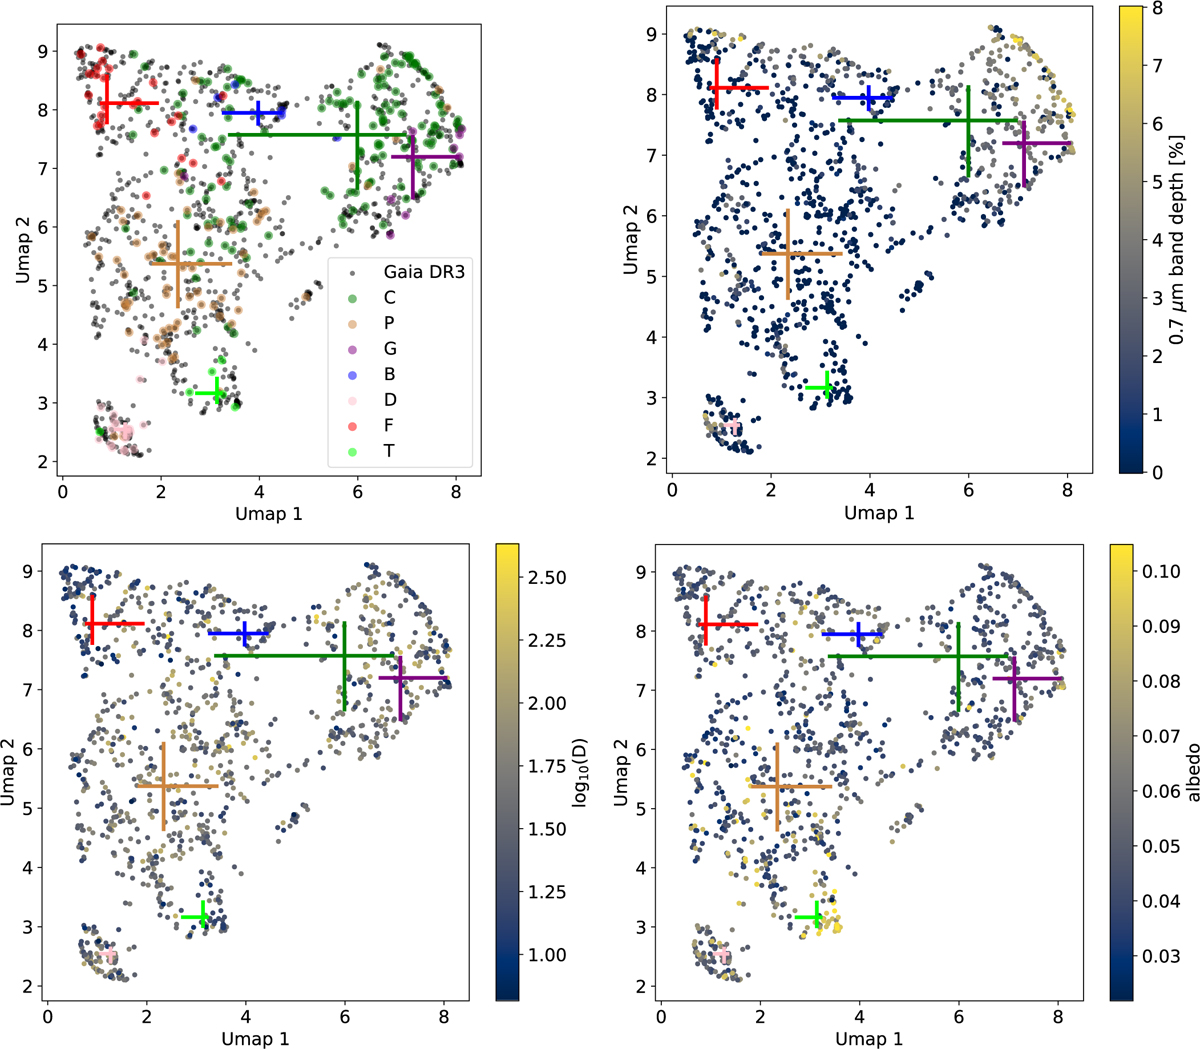
2D representation of feature space composed by s, s2, (s2 − s3), and (s4 − s3), after applying UMAP. The upper left panel shows all available Gaia spectra in grey, and those classified by Tholen are overplotted in colors following the taxonomy code. Crosses correspond to the median for each taxonomy and the size of the error bars is the interquartile range in all the panels. In the upper-right and lower panels, we have added the following information: the computed depth of the 0.7 µm band (in %), the logarithm of the asteroid diameter in kilometers, and the albedo, with an associated color scale shown in the right of each panel. The axes do not have a physical interpretability due to the nonlinearity of the method. From Fig. B.1, we can infer the physical properties of the UMAP space based on the parameters used to compute the space.
Current usage metrics show cumulative count of Article Views (full-text article views including HTML views, PDF and ePub downloads, according to the available data) and Abstracts Views on Vision4Press platform.
Data correspond to usage on the plateform after 2015. The current usage metrics is available 48-96 hours after online publication and is updated daily on week days.
Initial download of the metrics may take a while.