Fig. 7
Download original image
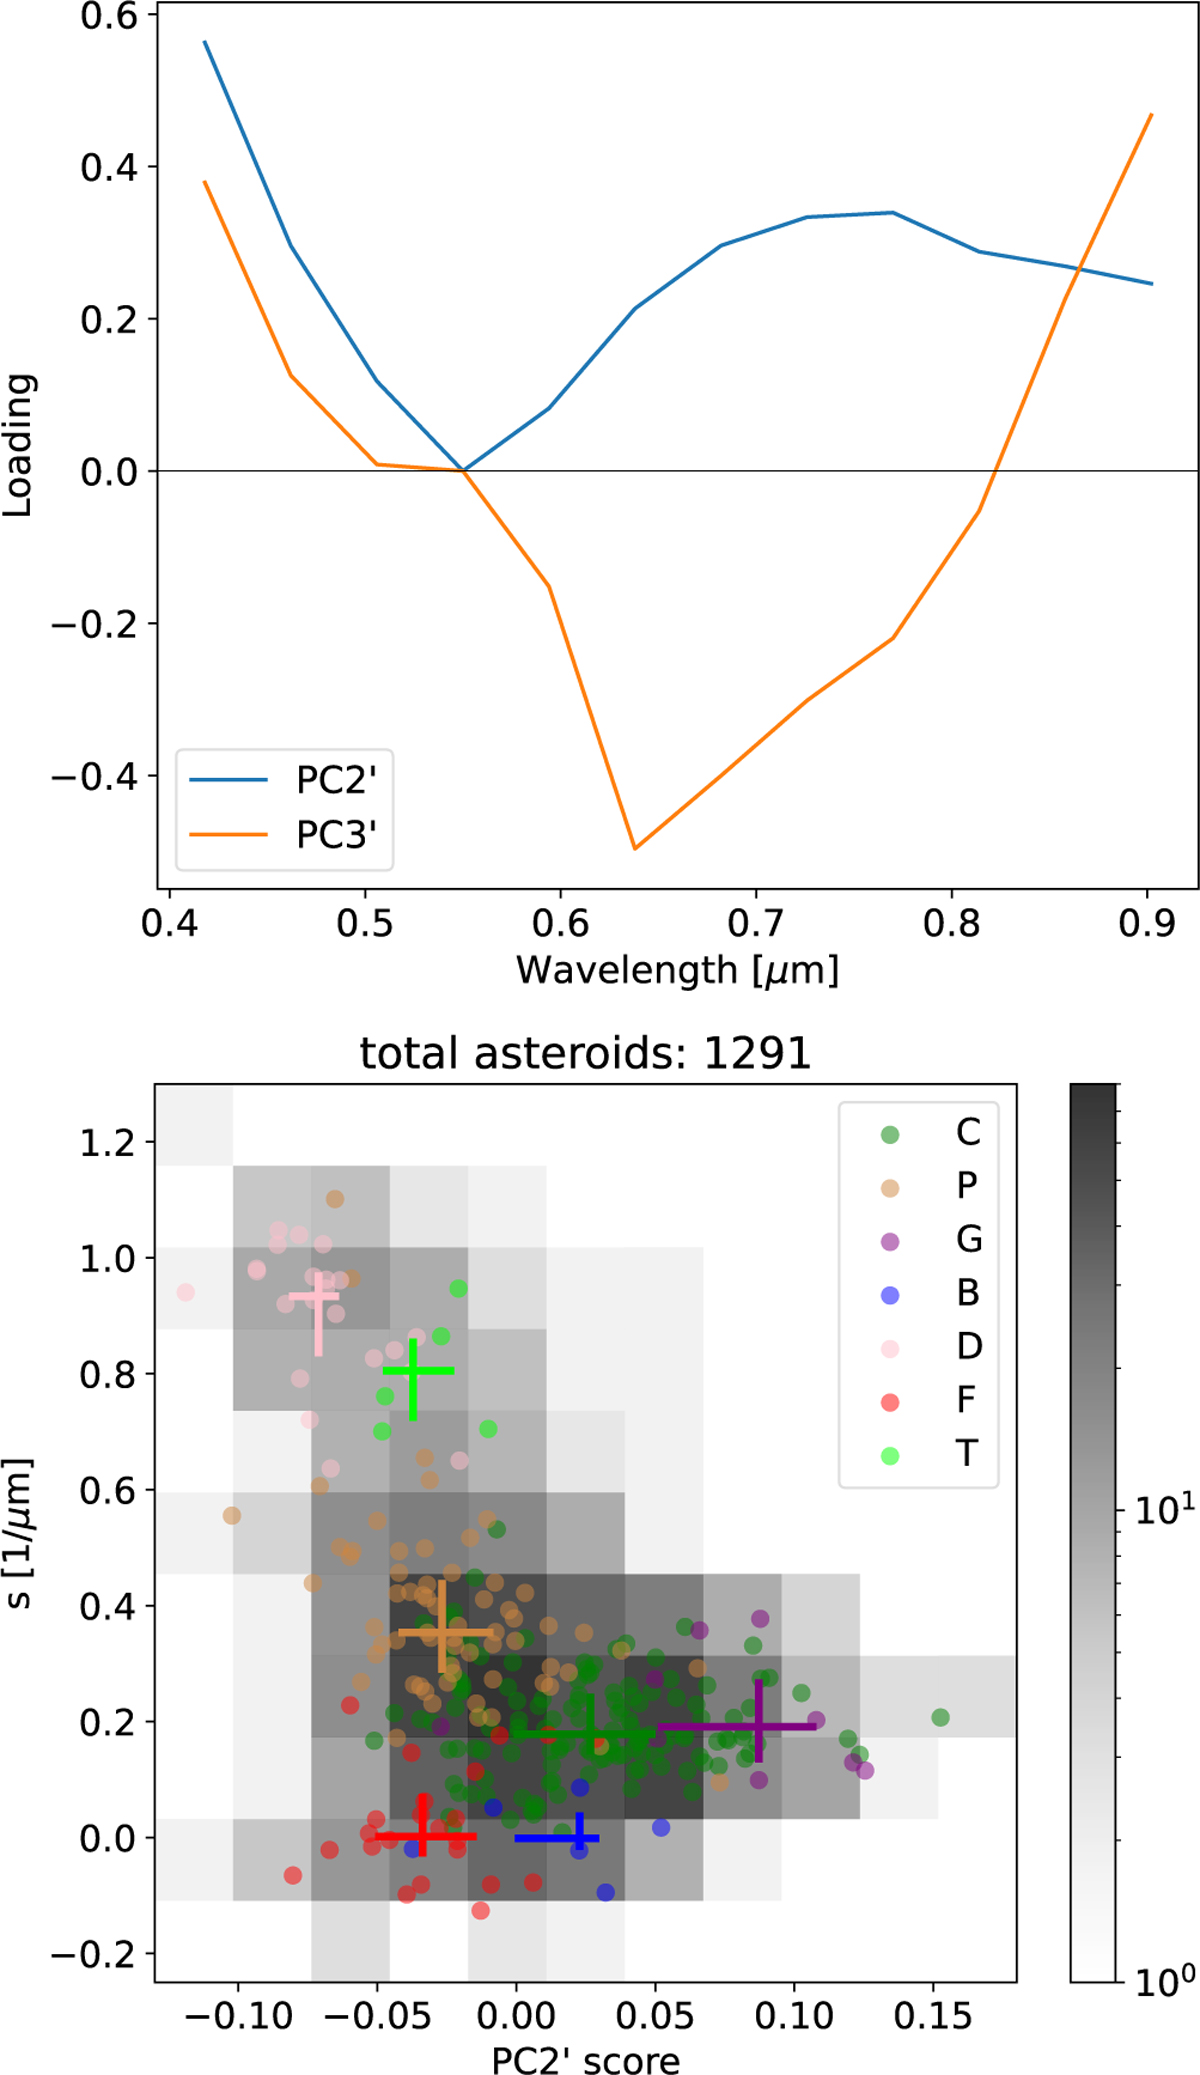
Results from the PCA applied over the reflectance spectra. The upper panel shows the two first components of our PCA. These loading values (elements of the eigenvectors, plotted as a function of wavelength) are used to weight the individual Gaia bands when calculating principal component scores. In the lower panel, we show the principal component space of visible slope s vs. PC2’ score. The grey hatch represents the density distribution of the 1290 Gaia asteroids that have good quality data between 0.418 to 0.902 µm. Those classified by Tholen are overplotted with color markers. Crosses correspond to the median for each taxonomy and the size of the error bars is the interquartile range.
Current usage metrics show cumulative count of Article Views (full-text article views including HTML views, PDF and ePub downloads, according to the available data) and Abstracts Views on Vision4Press platform.
Data correspond to usage on the plateform after 2015. The current usage metrics is available 48-96 hours after online publication and is updated daily on week days.
Initial download of the metrics may take a while.