Fig. 6
Download original image
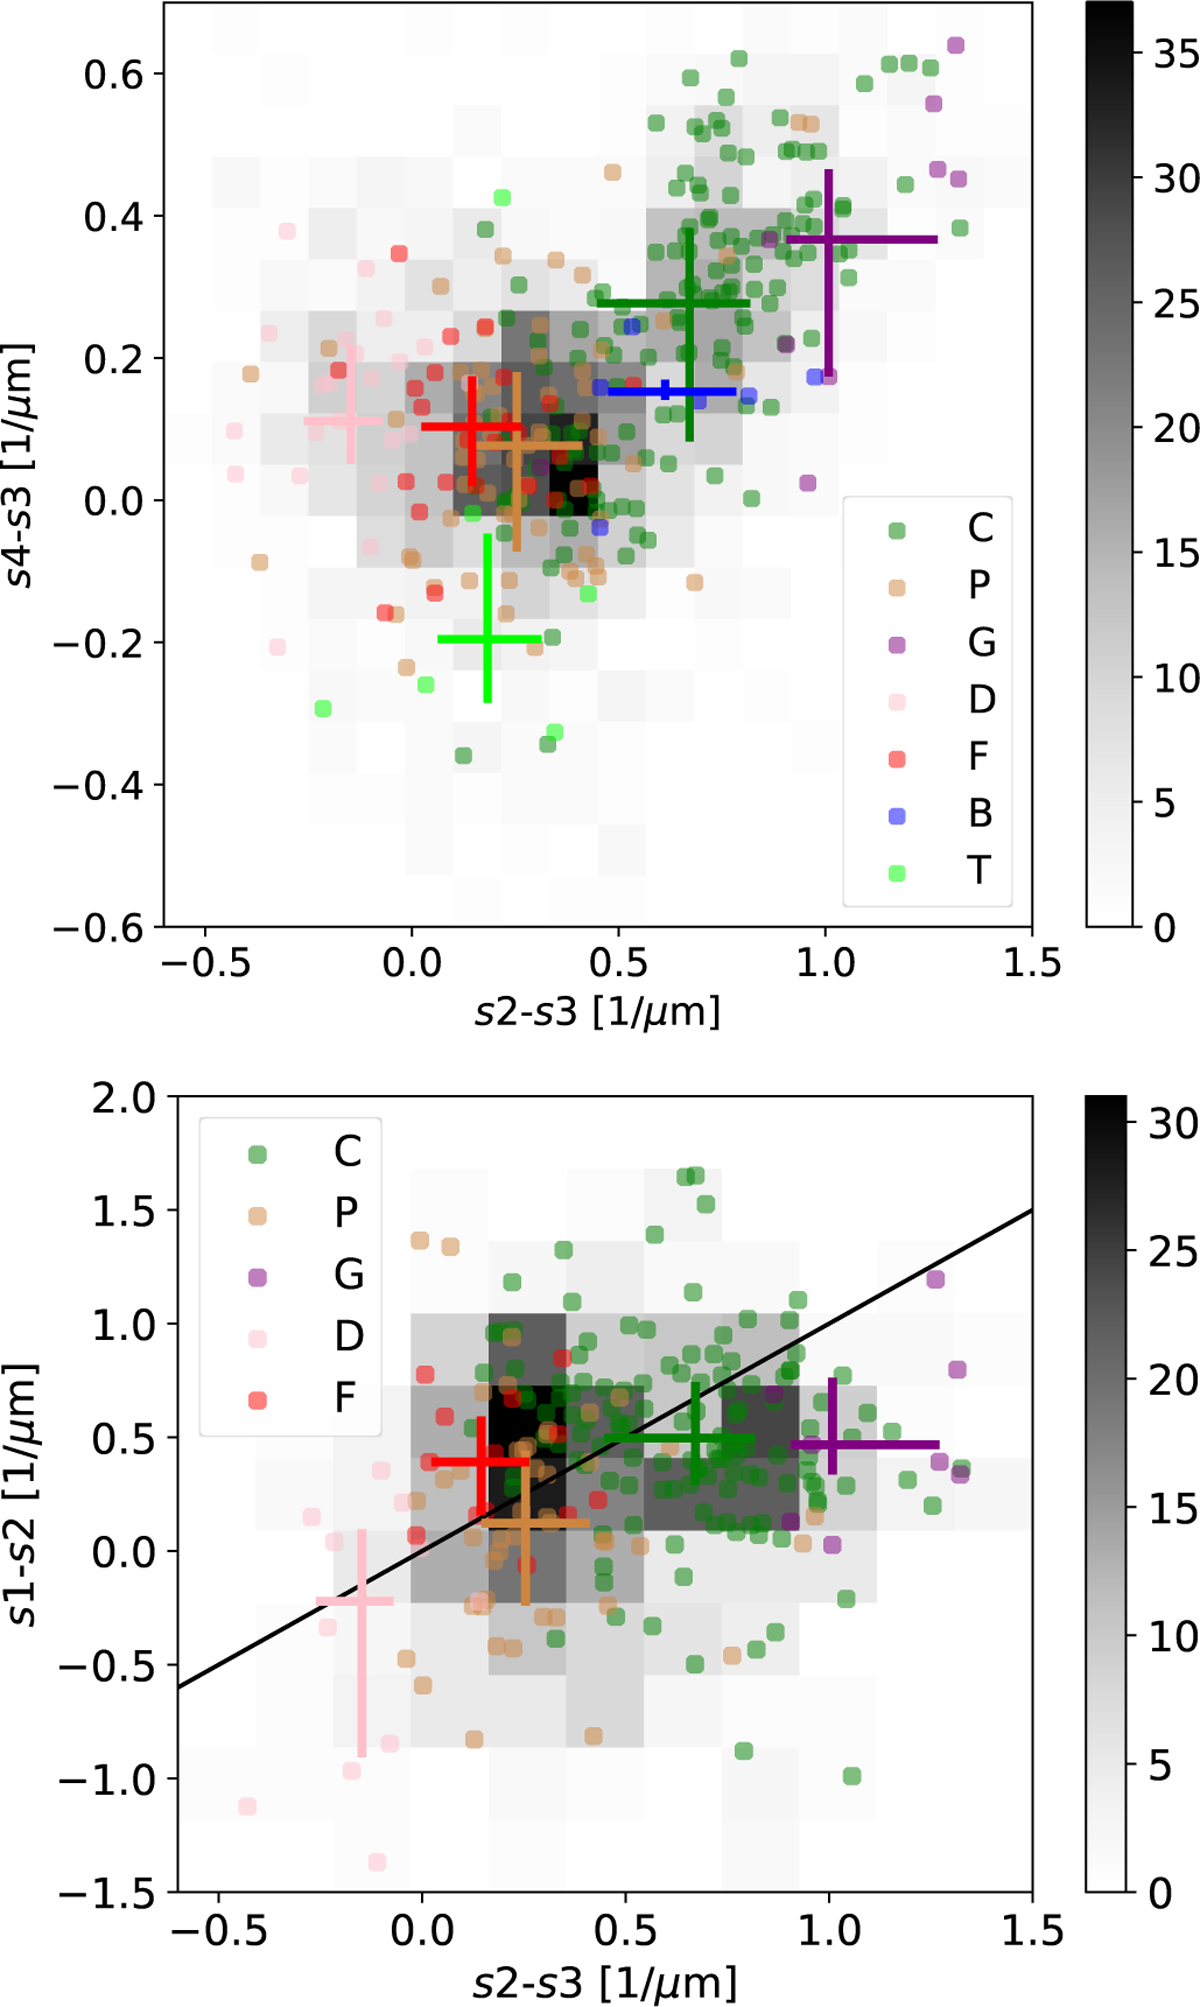
Density plot of (s2 − s3) vs. (s4 − s3) for the 1241 asteroids with these computed slopes in Gaia DR3 (upper panel). Colors represent asteroids classified by Tholen (1984). The crosses mark the median of each taxonomy and the size of the error bars is the interquartil range. The lower panel shows the same density plot, but for (s2 − s3) vs. (s1 − s2). In this case, a total of 498 asteroids had those slopes computed in Gaia DR3. We only include here the taxonomies with more than five members with computed s1 (i.e. C, P, G, D, and F).
Current usage metrics show cumulative count of Article Views (full-text article views including HTML views, PDF and ePub downloads, according to the available data) and Abstracts Views on Vision4Press platform.
Data correspond to usage on the plateform after 2015. The current usage metrics is available 48-96 hours after online publication and is updated daily on week days.
Initial download of the metrics may take a while.