Fig. 5
Download original image
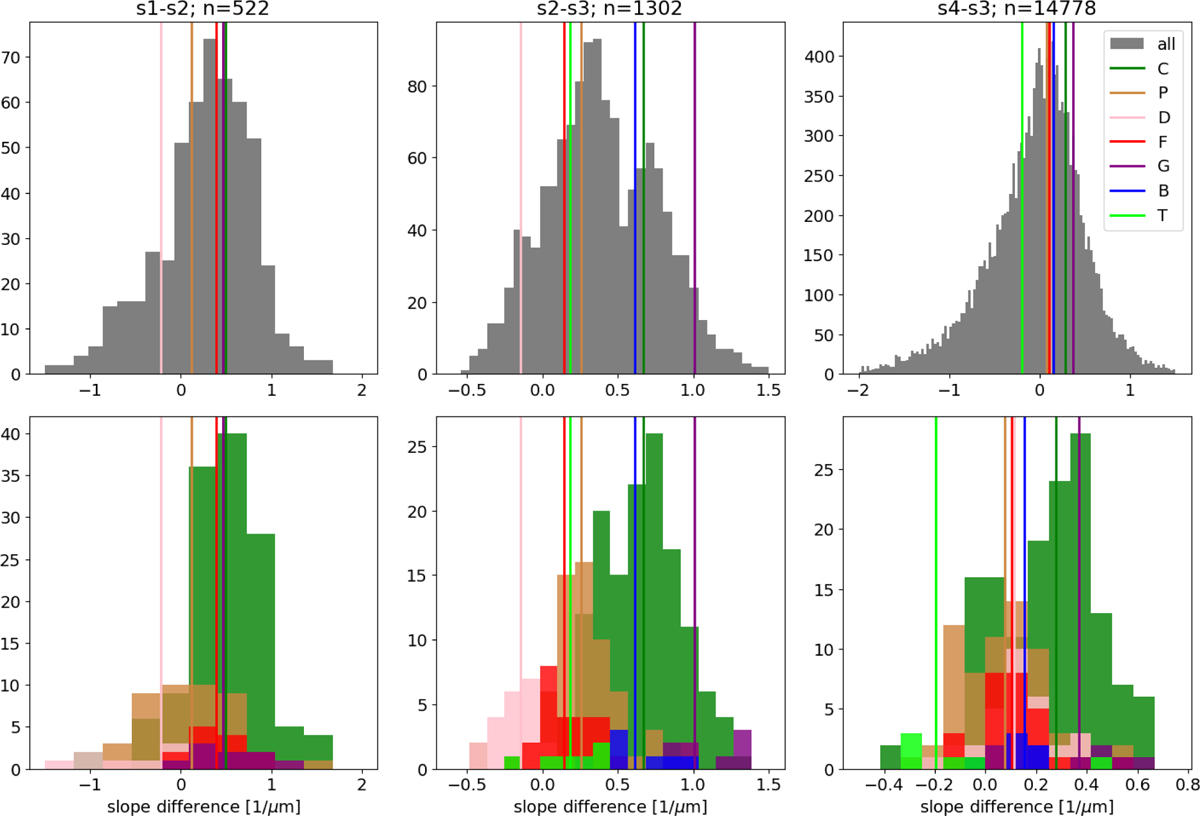
Distribution of slopes for the primitive asteroids in our sample (upper panel) and those classified by Tholen (1984) (bottom). Vertical lines indicate the computed median for each taxonomical class. The title of each column indicates the total number of asteroids with such difference computed. B- and T-types have less than five members with computed s1, thus, we decided not to show them in the (s1 − s2) plot. The rightest column does have not a shared x-axis as the general (s3 − s4) distribution is much wider than the classified ones.
Current usage metrics show cumulative count of Article Views (full-text article views including HTML views, PDF and ePub downloads, according to the available data) and Abstracts Views on Vision4Press platform.
Data correspond to usage on the plateform after 2015. The current usage metrics is available 48-96 hours after online publication and is updated daily on week days.
Initial download of the metrics may take a while.