Fig. 11
Download original image
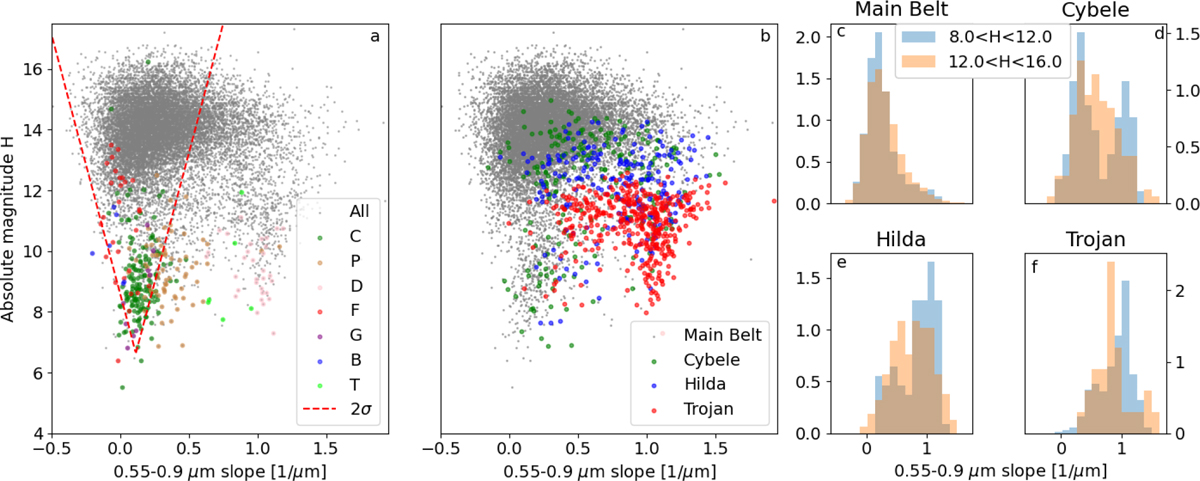
(a) Replication of Fig. 7 from Morate et al. (2019), but using primitive asteroids among the Gaia DR3 dataset. Colors indicate objects classified with Tholen taxonomy. Red lines are the 2σ dispersion of the sample as in Morate et al. (2019), corresponding to their Eq. (5). (b) Same as (a) but with main belt asteroids (in grey) separated from Cybeles (in green), Hildas (in blue), and Trojans (in red). See the main text for the semi-major axis values used to separate these populations, (c), (d), (e), and (ſ) show the visible spectral slope distribution for the four dynamical populations observed for absolute magnitudes 8 < H < 12 (in blue) and 12 < H < 16 (in beige).
Current usage metrics show cumulative count of Article Views (full-text article views including HTML views, PDF and ePub downloads, according to the available data) and Abstracts Views on Vision4Press platform.
Data correspond to usage on the plateform after 2015. The current usage metrics is available 48-96 hours after online publication and is updated daily on week days.
Initial download of the metrics may take a while.