Fig. 5.
Download original image
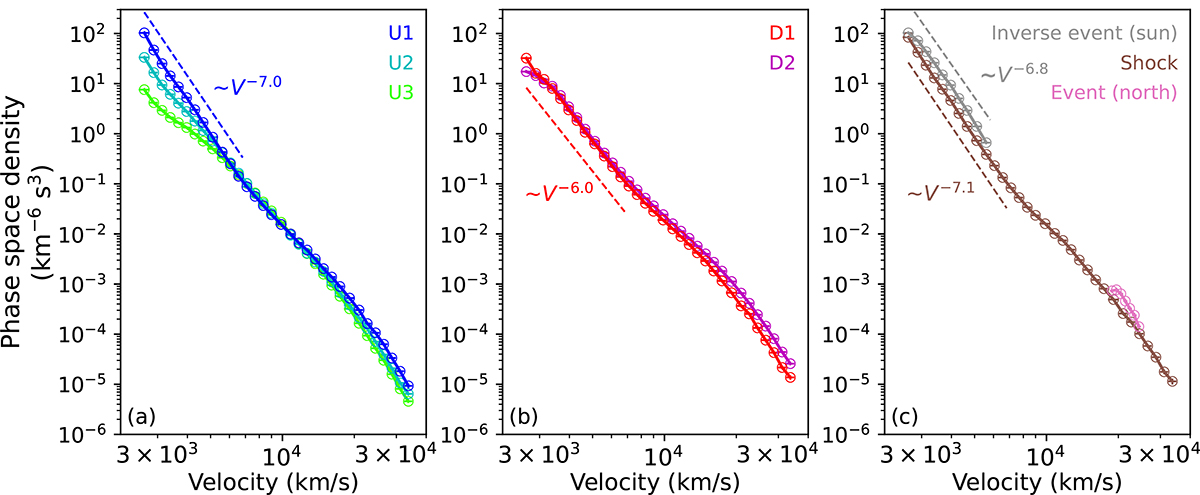
Omnidirectional averaged phase-space density vs. proton velocity in the SWF for different time intervals. Three upstream intervals (a) and two downstream intervals (b) are labeled in Figs. 1 and 2. In panel (c), “Shock” indicates the average spectrum in the 12-s interval centered at the shock front, “Inverse event (sun)” indicates the average spectrum in the inverse-velocity dispersion event (same interval as U1) measured by the sunward telescope, and “Event (north)” indicates the spectrum of the peak fluxes in the velocity dispersion event measured by the northward telescope. The dashed lines indicate the slope of the power-law fit to the spectra in corresponding colors. The uncertainties are plotted as vertical or horizontal bars (but smaller than the symbols).
Current usage metrics show cumulative count of Article Views (full-text article views including HTML views, PDF and ePub downloads, according to the available data) and Abstracts Views on Vision4Press platform.
Data correspond to usage on the plateform after 2015. The current usage metrics is available 48-96 hours after online publication and is updated daily on week days.
Initial download of the metrics may take a while.