Fig. 4.
Download original image
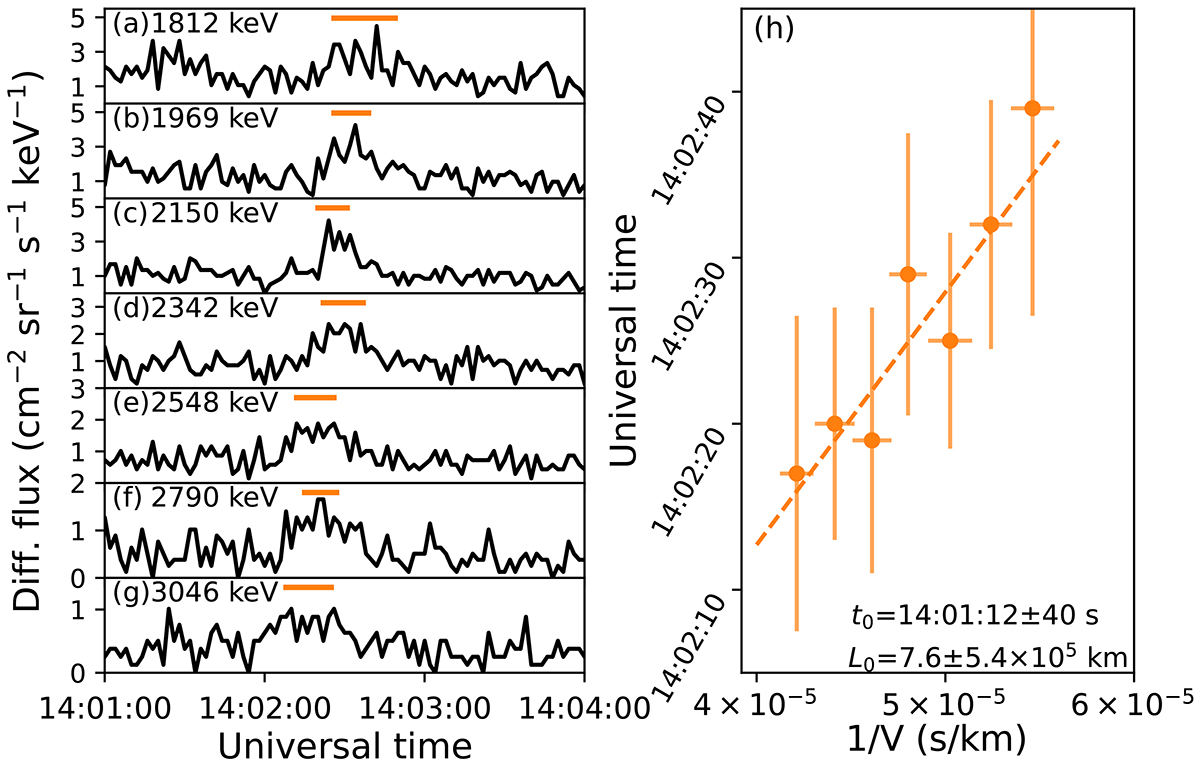
Velocity dispersion analysis of the velocity dispersion event. (a)–(g): proton fluxes measured by the northward telescope during the velocity dispersion event. The horizontal bar indicates the estimated most likely range of the peak time. (h): velocity dispersion analysis of the peak time t vs. the inverse of the velocity 1/V. The dashed line represents the linear regression to ![]() , where t0 is the peak injection time at the shock front, and the proton path length
, where t0 is the peak injection time at the shock front, and the proton path length ![]() , where the PA is ∼60° during this event.
, where the PA is ∼60° during this event.
Current usage metrics show cumulative count of Article Views (full-text article views including HTML views, PDF and ePub downloads, according to the available data) and Abstracts Views on Vision4Press platform.
Data correspond to usage on the plateform after 2015. The current usage metrics is available 48-96 hours after online publication and is updated daily on week days.
Initial download of the metrics may take a while.