Fig. 2.
Download original image
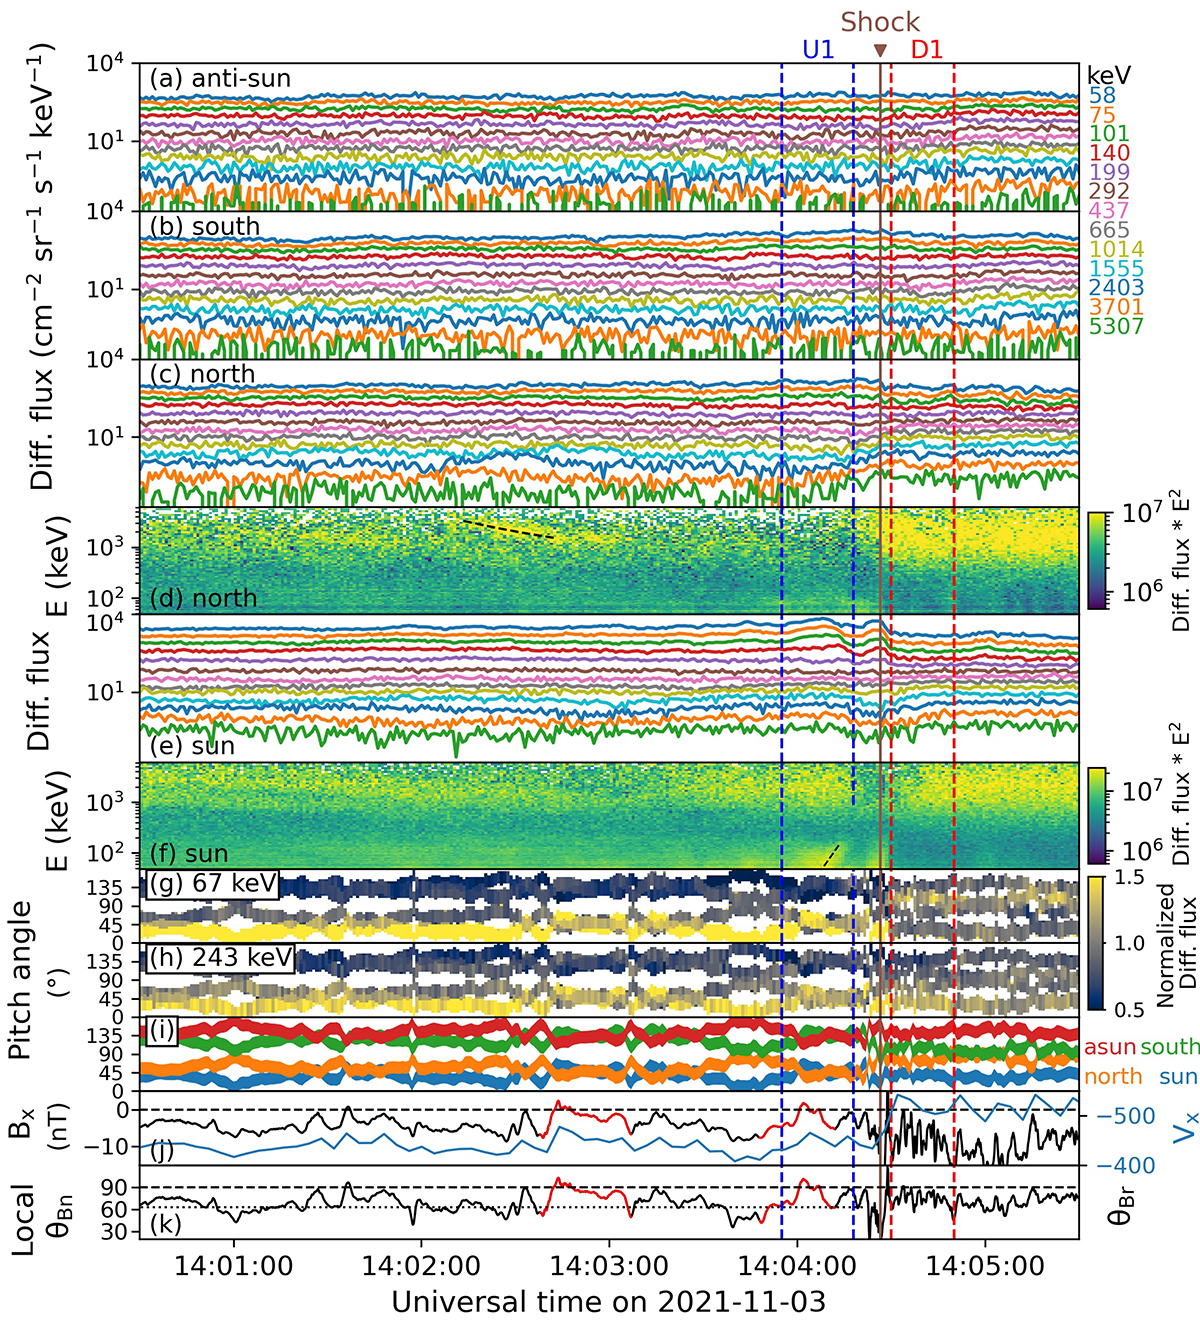
Overview plot in the 5-min vicinity of the shock on 2021 November 3. Panels (a)–(c), (e), and (g)–(h) show the same as Fig. 1, but on a shorter timescale. Panels (d) and (f) show the spectrogram of dynamic energy spectra measured by the northward (d) and sunward (f) telescopes in the spacecraft frame. The color scale represents the intensities of the differential flux multiplied by the energy squared. The dashed black line in panel (d) indicates the velocity dispersion feature, and the dashed black line in panel (f) indicates the inverse-velocity dispersion feature. (i): PA coverage of the four EPT telescopes. (j): X-component of the IMF Bx (black) and X-component of the solar wind velocity Vx (blue) in the spacecraft frame. (k): Angle between the IMF and the shock normal, local θBn, and the angle between the IMF and the radial direction, θBr. These two angles are equal to each other because the shock normal almost aligns with the radial direction. The apparent magnetic kinks or switchbacks are plotted in red, and the horizontal dotted line indicates the average angle in the ambient solar wind plasma. The vertical solid brown line marks the shock arrival. The vertical dashed lines bound an upstream and a downstream interval with labels at the top, which are analyzed in Fig. 5.
Current usage metrics show cumulative count of Article Views (full-text article views including HTML views, PDF and ePub downloads, according to the available data) and Abstracts Views on Vision4Press platform.
Data correspond to usage on the plateform after 2015. The current usage metrics is available 48-96 hours after online publication and is updated daily on week days.
Initial download of the metrics may take a while.