Fig. 1.
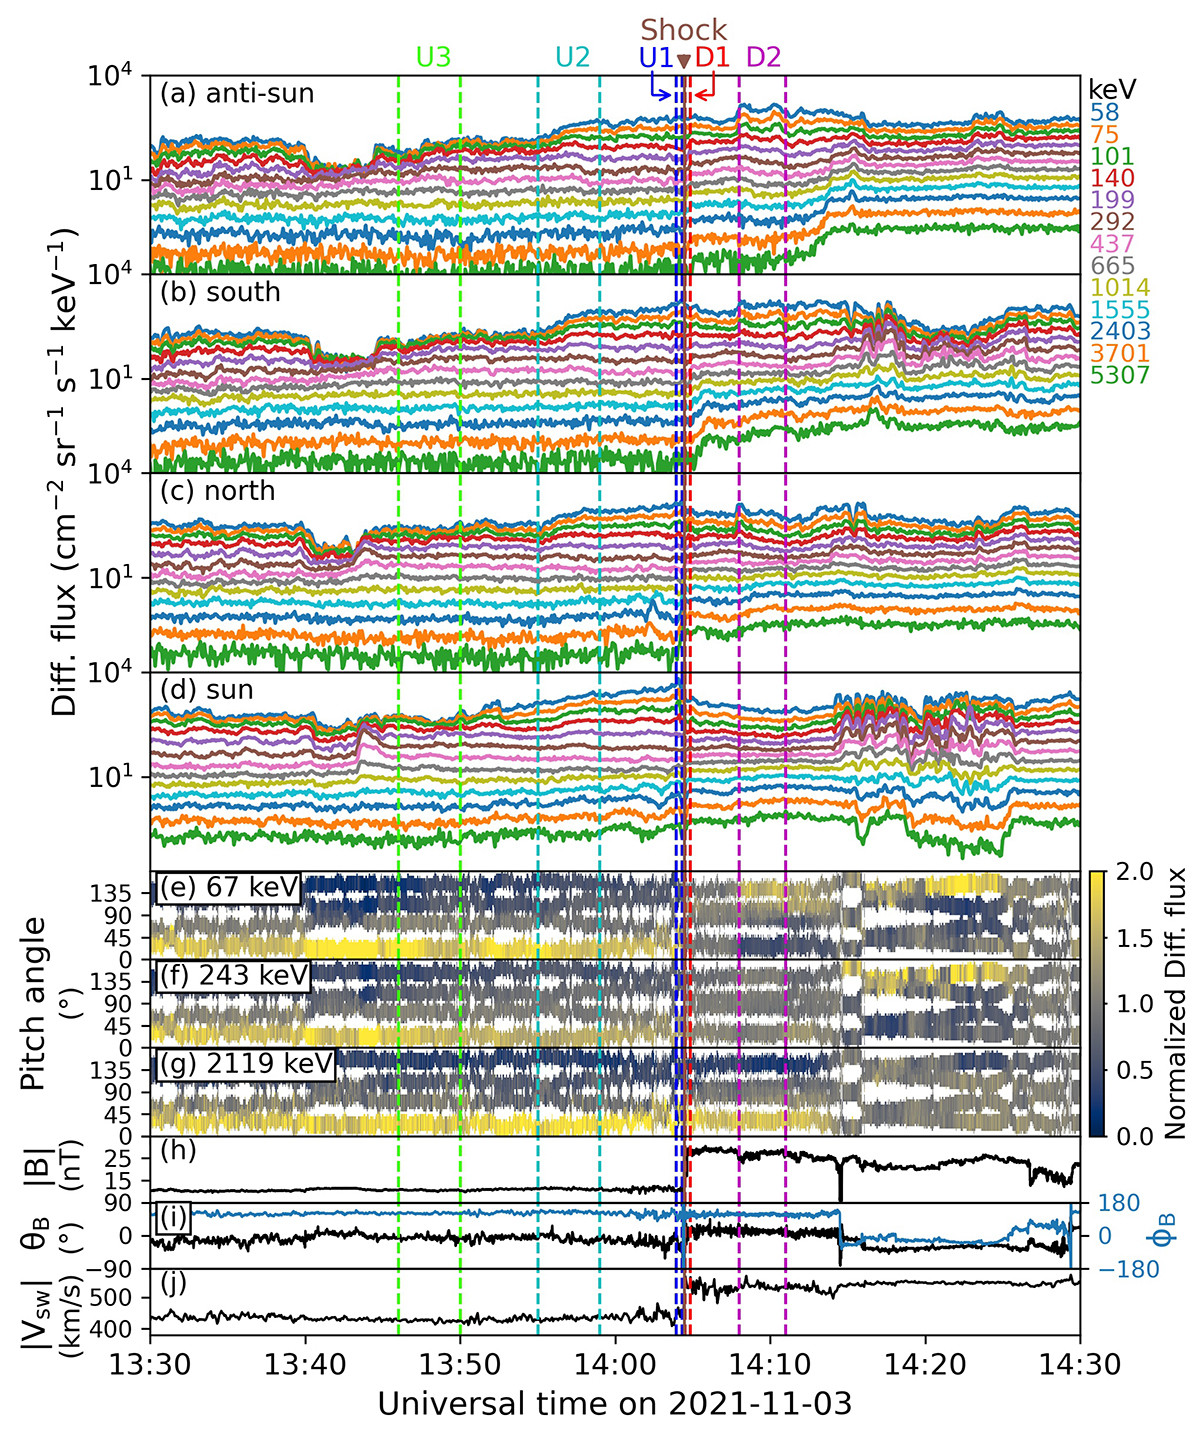
Download original image
Overview plot in the one-hour vicinity of the shock on 2021 November 3. (a)–(d) Differential flux vs. time of ∼50 − 6000 keV protons measured by the EPT telescopes pointing in the anti-sunward (a), southward (b), northward (c), and sunward (d) directions. The 64 energy bins arranged in the spacecraft frame are grouped into 13 logarithmically spaced bins. Their central energies are labeled in the right corner. (e)–(g) PAD spectrogram of protons in energy ranges of 52–84 keV (e), 195–297 keV (f), and 1697–2588 keV (g) in the SWF. The PAD is normalized by the flux averaged over all PAs for each time bin. Isotropic distributions show values around one (green) in all PA directions, and the beamed distributions exhibit higher values (red) in the beaming direction and lower values (blue) in the other directions. (h) Magnitude |B| of the IMF. (i) Elevation angle θB (black) and azimuthal angle ϕB (blue) of the IMF. (j) Solar wind proton bulk speed |Vsw|. The IMF and solar wind speed are measured in the spacecraft frame. The solid brown line marks the shock arrival. The dashed lines bound several time intervals with labels at the top, which are analyzed in Fig. 5.
Current usage metrics show cumulative count of Article Views (full-text article views including HTML views, PDF and ePub downloads, according to the available data) and Abstracts Views on Vision4Press platform.
Data correspond to usage on the plateform after 2015. The current usage metrics is available 48-96 hours after online publication and is updated daily on week days.
Initial download of the metrics may take a while.