Fig. 9.
Download original image
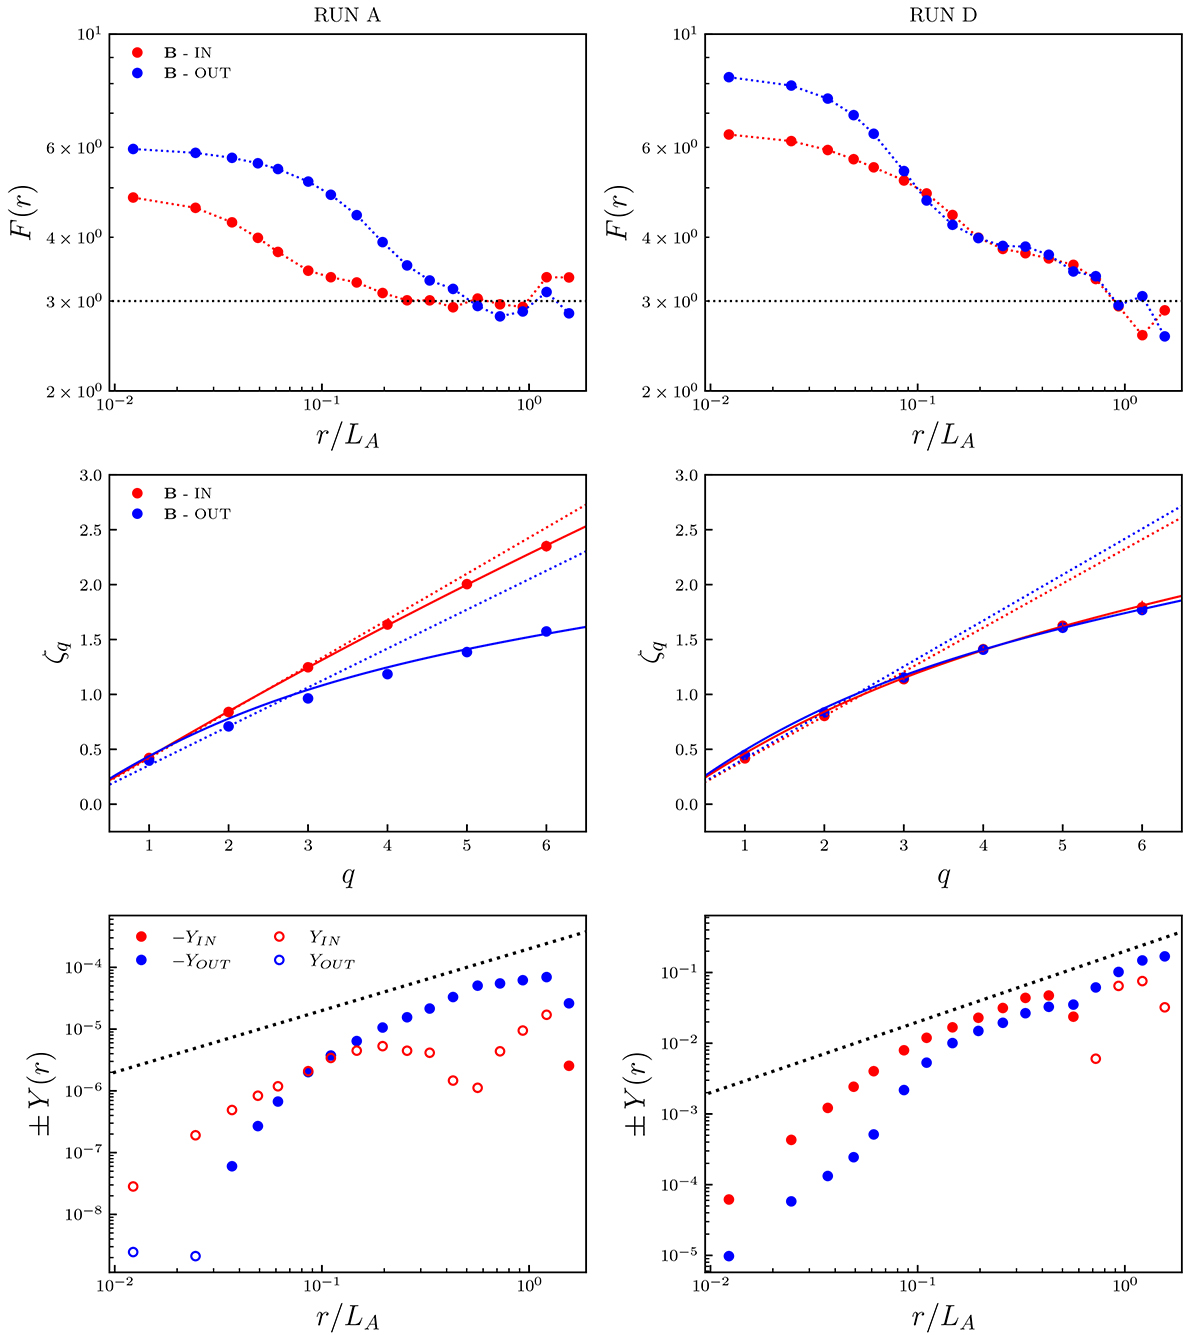
Local analysis of turbulent properties inside and outside the flux rope for RUN A and RUN D. Top: flatness F(r) of magnetic field increments as a function of separation scale r for RUN A (left) and RUN D (right) and for data sampled inside (red) and outside (blue) the flux rope. Dotted line is the reference Gaussian flatness value. Middle: scaling exponents ζq as function of order q for RUN A (left) and RUN D (right) evaluated inside (red) and outside (blue) the flux rope for the magnetic field. Dotted lines represent the linear scaling, while solid lines indicate the p-model best fit for each data sample. The Hurst exponents h = ζ2/2 are 0.42 (inside) and 0.35 (outside) for RUN A and 0.40 (inside) and 0.42 (outside) for RUN D. Bottom: Politano-Pouquet’s term Y(r) as function of separation scale r, computed inside (red) and outside (blue) the flux rope for RUN A (left) and RUN D (right). The dotted lines indicate the linear scaling. Filled circles correspond to −Y(r) and empty circles to Y(r).
Current usage metrics show cumulative count of Article Views (full-text article views including HTML views, PDF and ePub downloads, according to the available data) and Abstracts Views on Vision4Press platform.
Data correspond to usage on the plateform after 2015. The current usage metrics is available 48-96 hours after online publication and is updated daily on week days.
Initial download of the metrics may take a while.