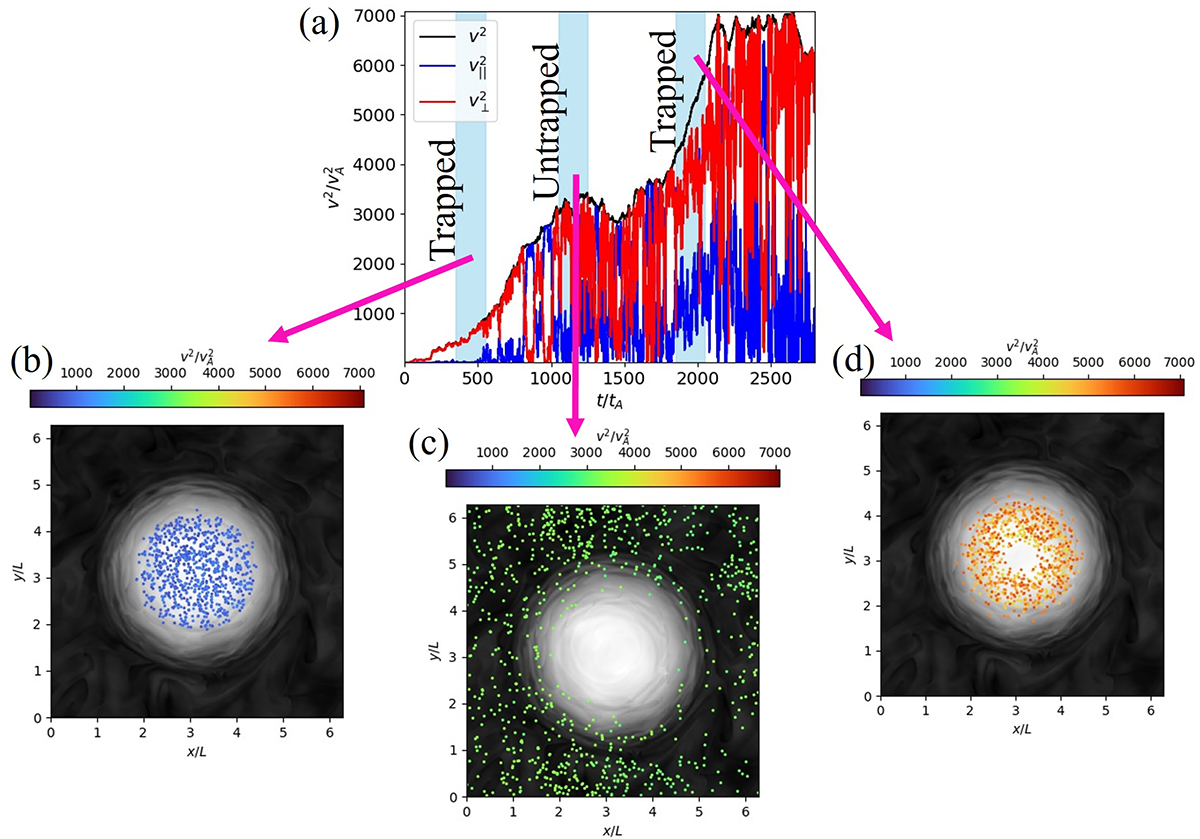
Fig. 14.
Download original image
Energy time-history and position of one of the most accelerated particles in the simulations. (a): total (black), perpendicular (red), and parallel (blue) energy for one of the most accelerated particles in the simulations. (b)–(d): particle position during the shaded times in (a) colored by particle energy. In the background, the magnetic field magnitude is shown in gray scale for the z = Lbox/2 plane.
Current usage metrics show cumulative count of Article Views (full-text article views including HTML views, PDF and ePub downloads, according to the available data) and Abstracts Views on Vision4Press platform.
Data correspond to usage on the plateform after 2015. The current usage metrics is available 48-96 hours after online publication and is updated daily on week days.
Initial download of the metrics may take a while.