Open Access
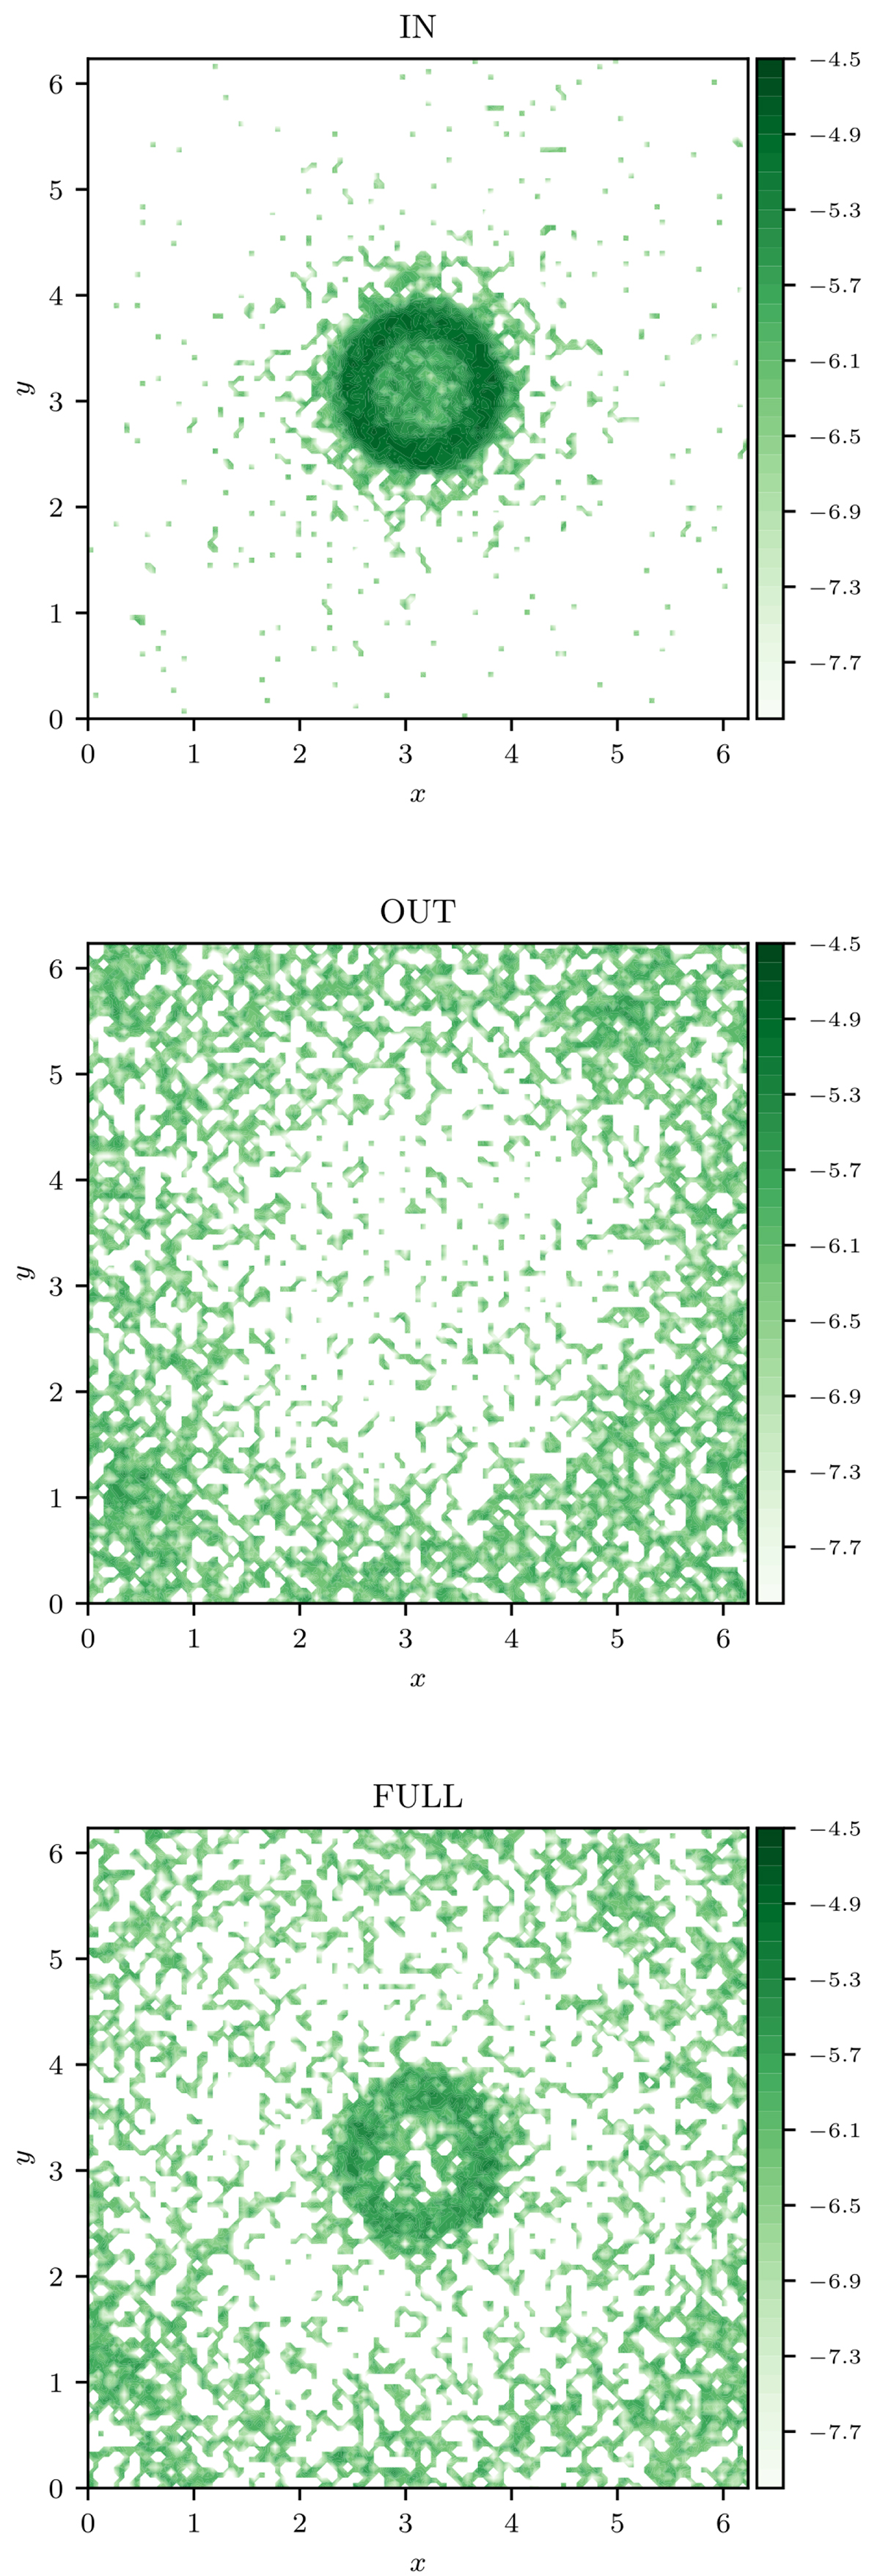
Fig. 11.
Download original image
Particle density in perpendicular plane (x, y) averaged along the z direction for RUN A and at the time t ≃ 1200 tA. Top, center, and bottom plots refer to injecting particles inside and outside the flux rope and randomly in the entire box, respectively.
Current usage metrics show cumulative count of Article Views (full-text article views including HTML views, PDF and ePub downloads, according to the available data) and Abstracts Views on Vision4Press platform.
Data correspond to usage on the plateform after 2015. The current usage metrics is available 48-96 hours after online publication and is updated daily on week days.
Initial download of the metrics may take a while.