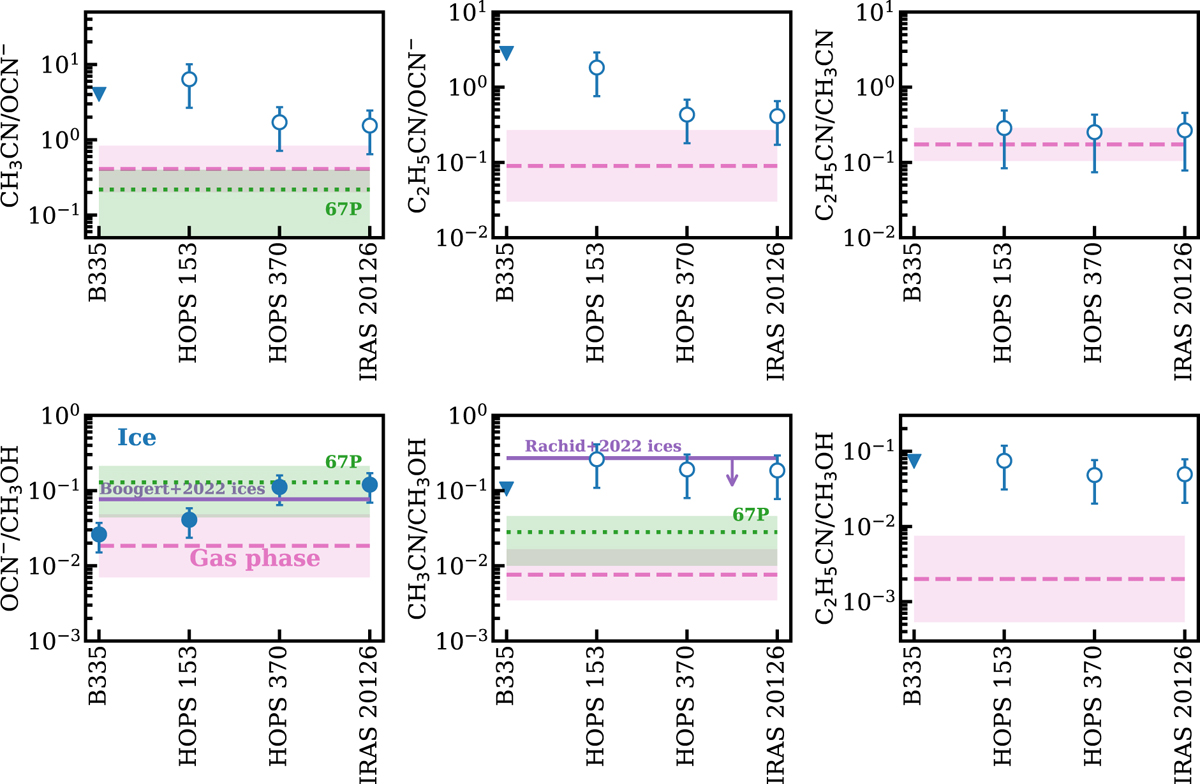
Fig. 5
Download original image
Ice column density ratios (blue data points) of species studied in this work with respect to each other and methanol taken from Slavicinska et al. (in prep.). Filled circles show firm detections, empty ones present the tentative column densities, and filled triangles show the upper limit values. The gas-phase column density ratios of many sources from the literature are shown in the pink shaded areas (the mean and standard deviation are taken from Nazari et al. 2022). Here, for the gas-phase observations we substitute OCN− by HNCO because OCN− is thought to turn into HNCO once sublimated. The purple lines show the previously measured ice column density ratios (median of values from Boogert et al. 2022) or upper limits (Rachid et al. 2022) in other sources. The abundance ratios of CH3CN/CH3OH, CH3CN/HNCO, and HNCO/CH3OH for comet 67P are also shown in green (Rubin et al. 2019). See Fig. A.4 for similar plots, but corrected for potential differences in emitting areas of the N-bearing species and methanol.
Current usage metrics show cumulative count of Article Views (full-text article views including HTML views, PDF and ePub downloads, according to the available data) and Abstracts Views on Vision4Press platform.
Data correspond to usage on the plateform after 2015. The current usage metrics is available 48-96 hours after online publication and is updated daily on week days.
Initial download of the metrics may take a while.