Fig. 4
Download original image
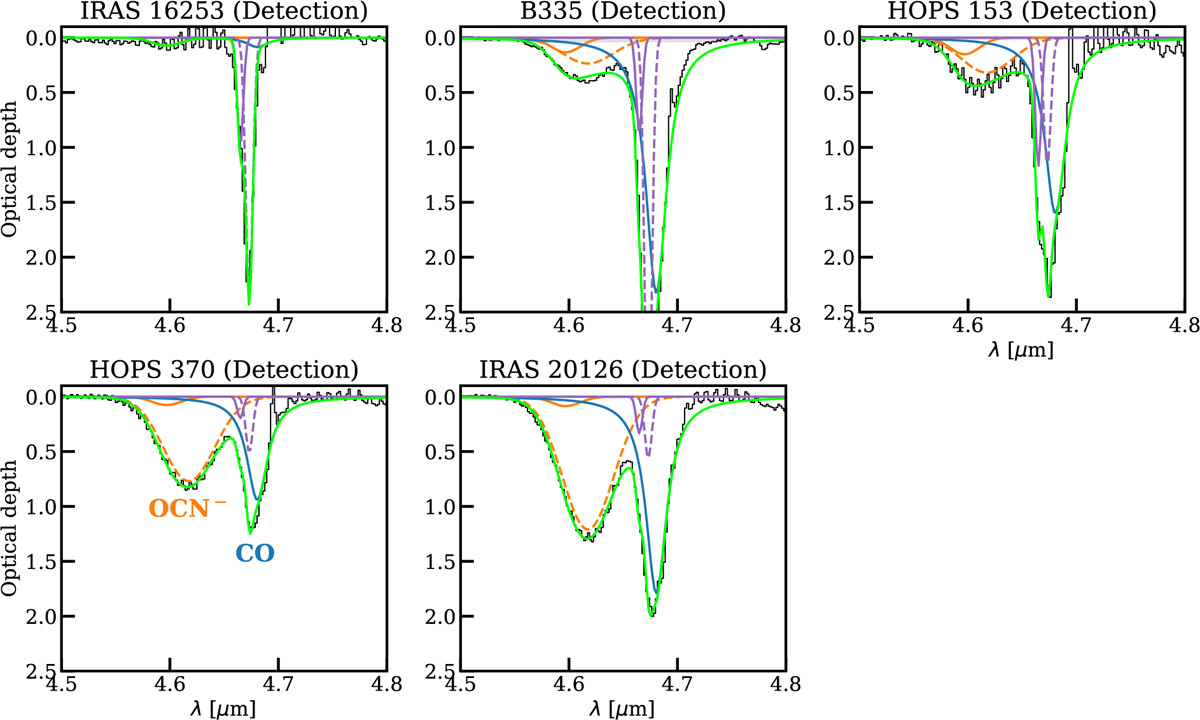
Fitted model to OCN− absorption feature. Orange dashed and solid lines show red and blue OCN− (sometimes attributed to CO absorption instead), showing that the bulk of the XCN feature is dominated by OCN−. The blue and purple lines show the Lorentzian and Gaussian contributions to the CO band, respectively. The XCN and CO bands are fit simultaneously. The total fit is shown in green. The 3σ uncertainty on optical depth is shown in shaded gray. The y-axis limit is set for better visibility of the ice features in all sources, which cuts off the fit to the CO band in B335. The fit to the CO ice band in B335 is similar to the other sources and does not overpredict the data.
Current usage metrics show cumulative count of Article Views (full-text article views including HTML views, PDF and ePub downloads, according to the available data) and Abstracts Views on Vision4Press platform.
Data correspond to usage on the plateform after 2015. The current usage metrics is available 48-96 hours after online publication and is updated daily on week days.
Initial download of the metrics may take a while.