Fig. 3
Download original image
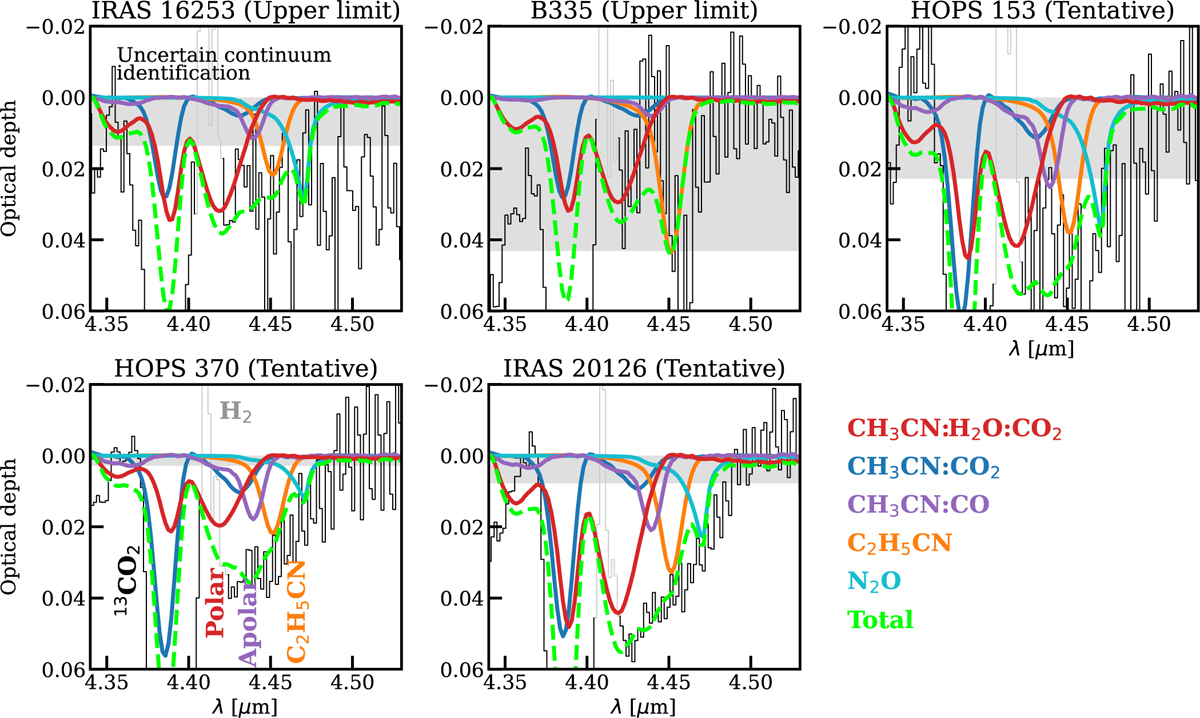
Fit CH3CN, C2H5CN, and N2O models on top of continuum-subtracted data (black). The models of the various mixtures of the ice are color-coded as follows: CH3CN:H2O:CO2 (1:5:2, 50 K, red), CH3CN:CO2 (1:10, 15 K, blue), CH3CN:CO (1:10, 80 K, purple), C2H5CN (orange, 50 K), and N2O (70 K, cyan). The total fit is shown with the dashed green line. The 3σ uncertainty on optical depth is shown in shaded gray. Continuum identification of IRAS 16253 is uncertain, and thus the significance of the observed feature is unclear. The H2 emission line is shown in gray and ignored when fitting (see also Fig. A.3).
Current usage metrics show cumulative count of Article Views (full-text article views including HTML views, PDF and ePub downloads, according to the available data) and Abstracts Views on Vision4Press platform.
Data correspond to usage on the plateform after 2015. The current usage metrics is available 48-96 hours after online publication and is updated daily on week days.
Initial download of the metrics may take a while.