Fig. 1
Download original image
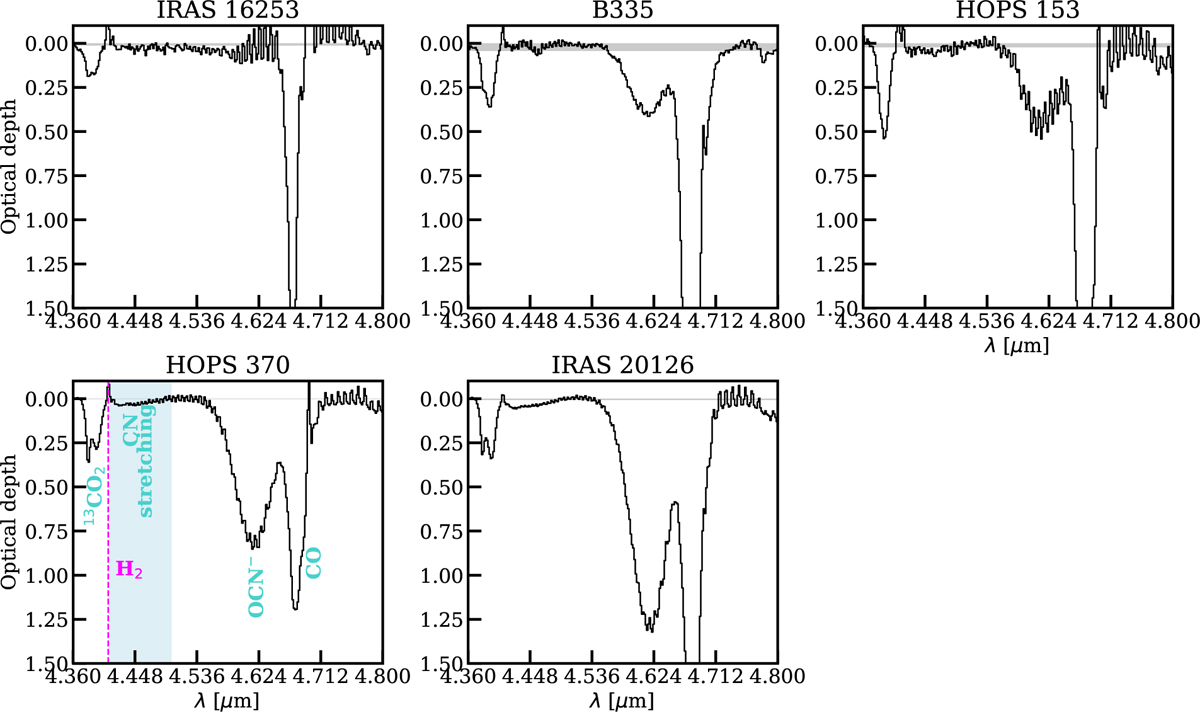
Calculated optical depth for all five sources in wavelength range of interest. Gray shaded area shows the optical-depth 3σ uncertainty level. Although the spectra are extracted off-source (see Table A.1), some CO emission lines are still seen in the spectra. The CN stretching mode vibration band is shaded in light blue. The emission line between the 13CO2 ice feature and the CN stretching band is the H2 0 – 0 S(10) line (marked with the dashed magenta line).
Current usage metrics show cumulative count of Article Views (full-text article views including HTML views, PDF and ePub downloads, according to the available data) and Abstracts Views on Vision4Press platform.
Data correspond to usage on the plateform after 2015. The current usage metrics is available 48-96 hours after online publication and is updated daily on week days.
Initial download of the metrics may take a while.