Fig. 3
Download original image
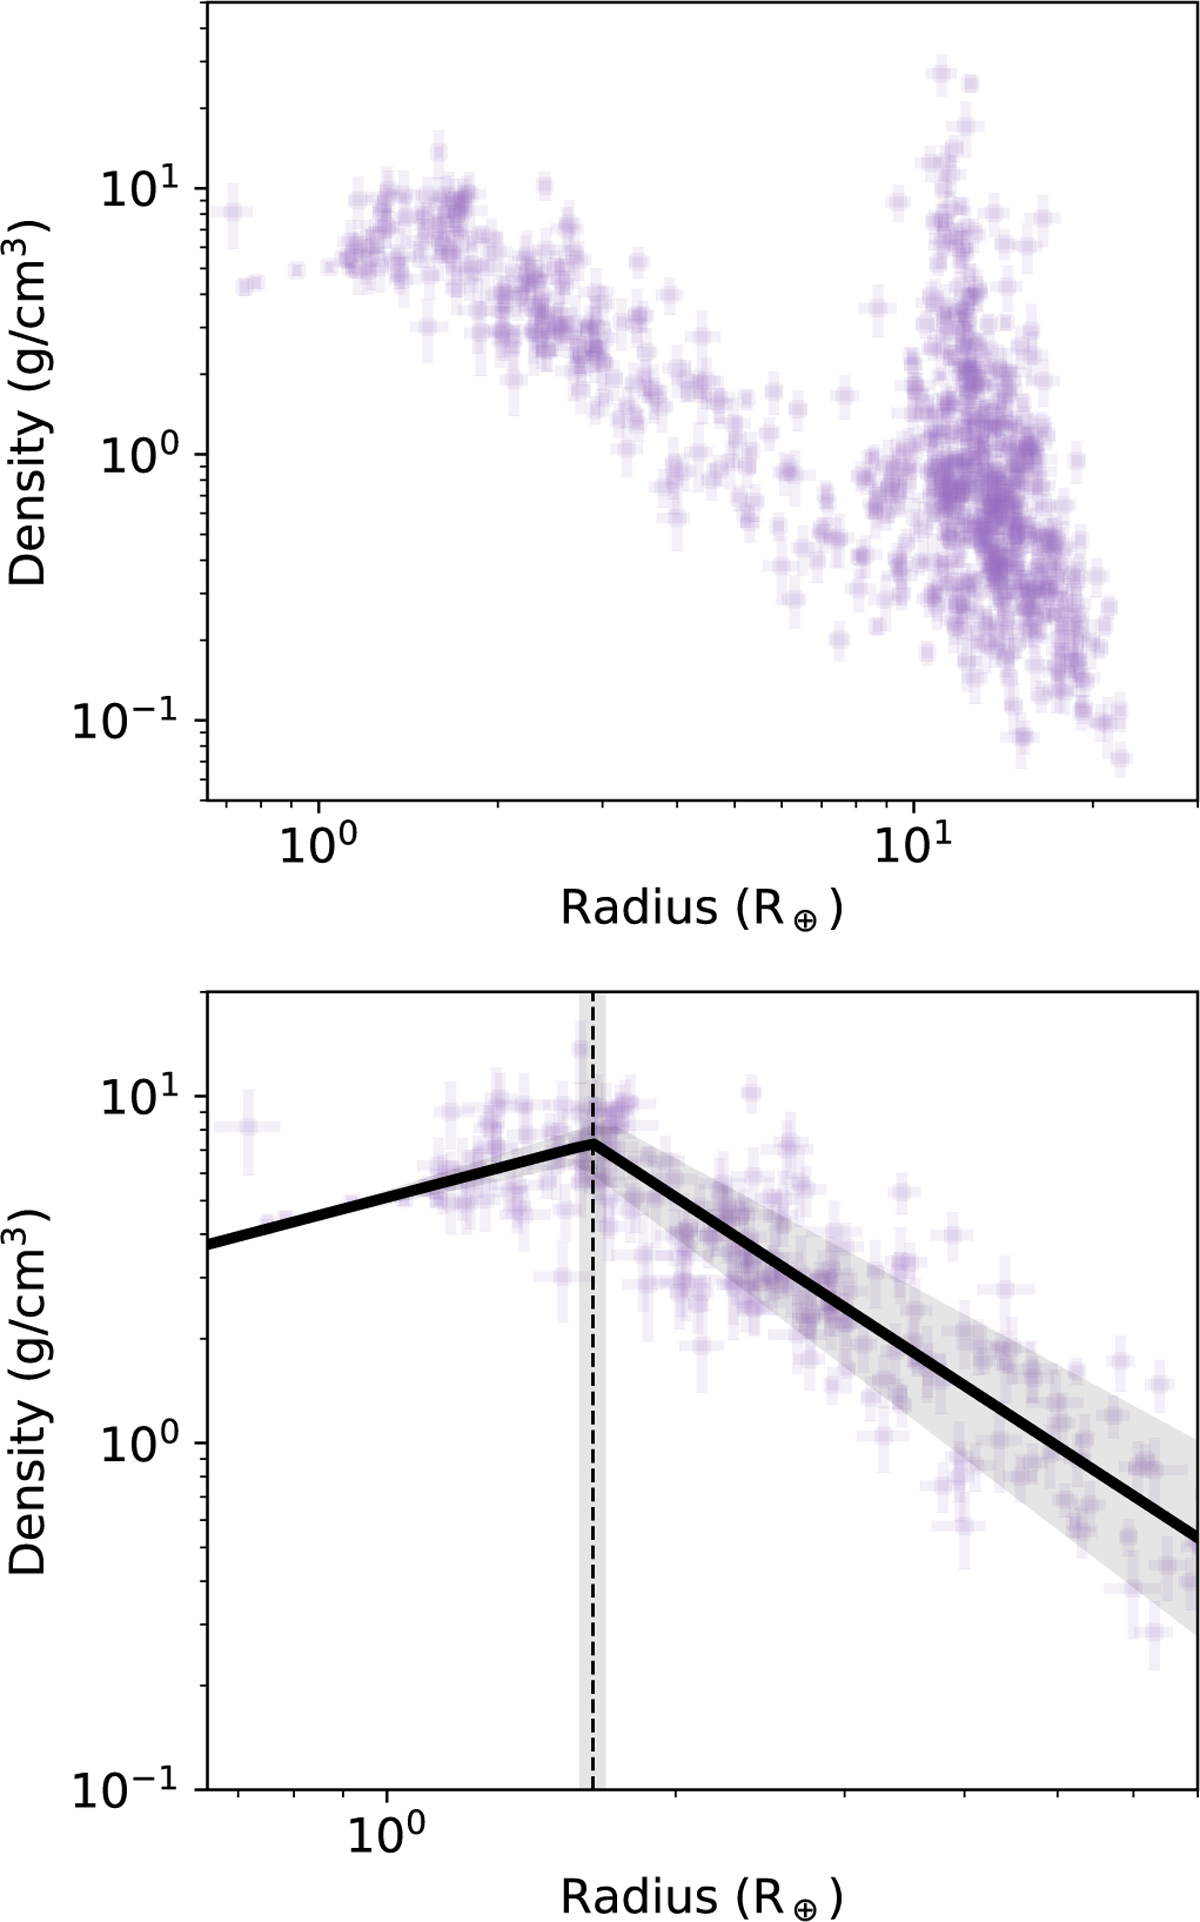
Radius–density data from the PlanetS catalog and the derived relation. Top: radius-density distribution of all exoplanets from the PlanetS Catalog. Bottom: the exoplanets from the PlanetS Catalog smaller than 7 R⊕ are displayed together with the mass–density relation (solid black line) and the corresponding breakpoints (dashed line). The light-shaded areas are the 1σ-uncertainties.
Current usage metrics show cumulative count of Article Views (full-text article views including HTML views, PDF and ePub downloads, according to the available data) and Abstracts Views on Vision4Press platform.
Data correspond to usage on the plateform after 2015. The current usage metrics is available 48-96 hours after online publication and is updated daily on week days.
Initial download of the metrics may take a while.