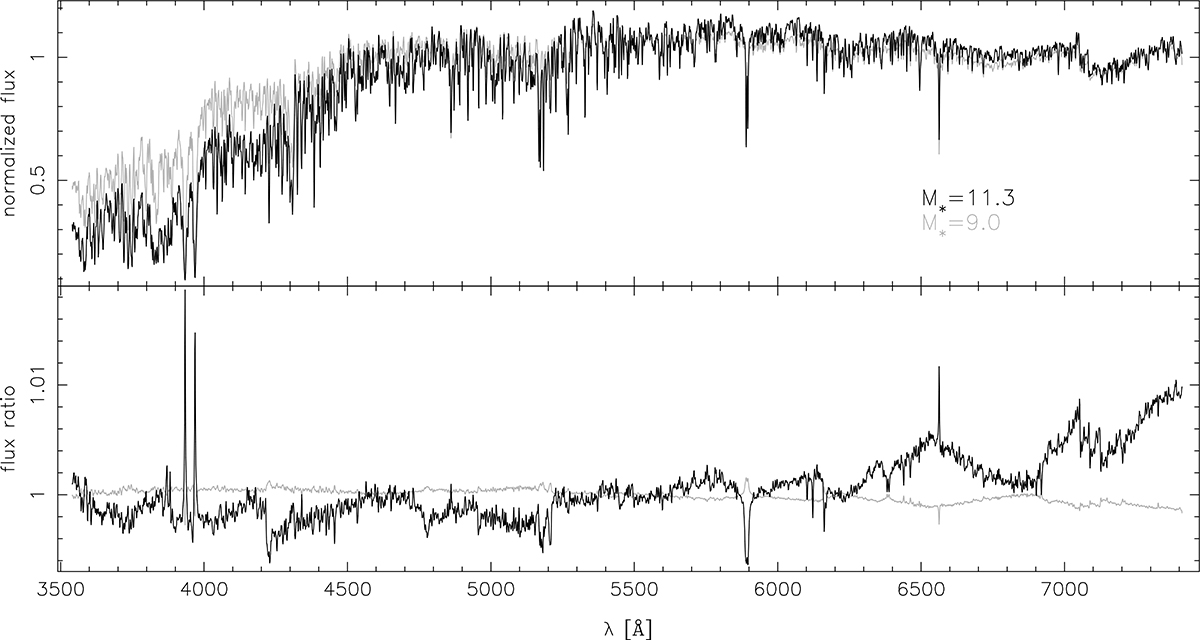
Fig. 7.
Download original image
Examples of synthetic MILES spectra (top panel) for two model galaxies in the CR-IGIMF run of GAEA. The black and gray curves correspond to a high- (M⋆ ∼ 11.3) and low-mass (M⋆ ∼ 9) galaxy, respectively. The bottom panel shows the ratio of each spectrum to that obtained for an MW IMF. Both spectra are at the nominal resolution of MILES (∼2.5 Å FWHM).
Current usage metrics show cumulative count of Article Views (full-text article views including HTML views, PDF and ePub downloads, according to the available data) and Abstracts Views on Vision4Press platform.
Data correspond to usage on the plateform after 2015. The current usage metrics is available 48-96 hours after online publication and is updated daily on week days.
Initial download of the metrics may take a while.