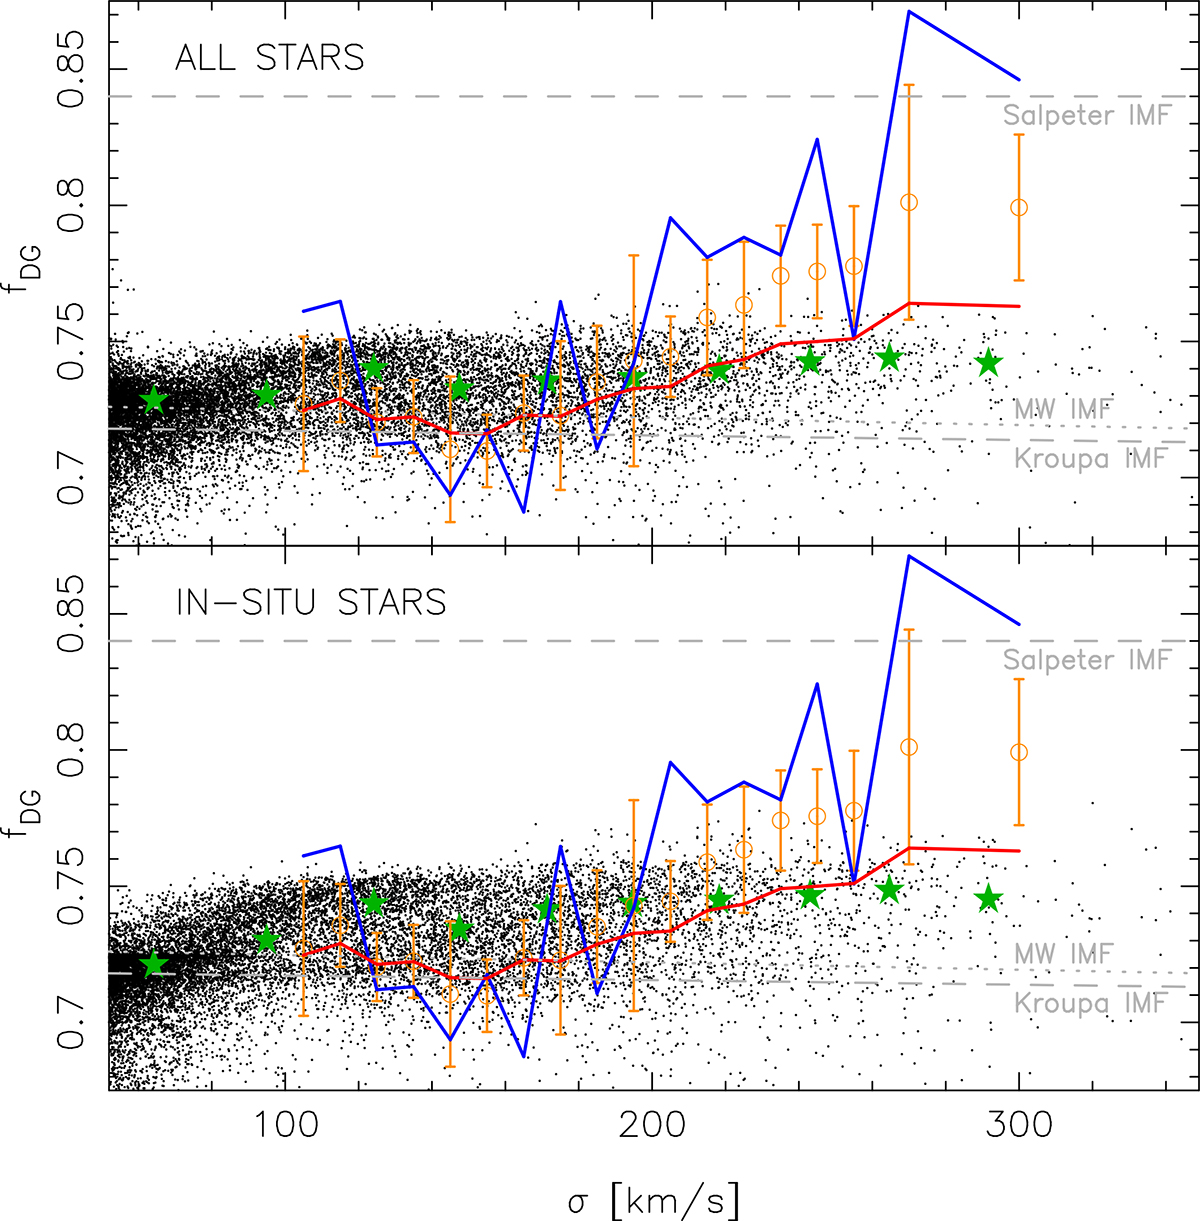
Fig. 6.
Download original image
Ratio of dwarf-to-giant stars in the IMF, fdg, plotted against the velocity dispersion of model galaxies, σ, for the CR-IGIMF run (black dots). The top and bottom panels are obtained by considering all stars in the model and those formed in situ, respectively. The green stars show the binned median trends, and the blue line corresponds to the IMF–σ relation from La Barbera et al. (2013). The orange circles with error bars show the latter relation corrected to an aperture of 1 Re, and the red line corresponds to an infinite aperture (see text). The expected fdg values for a Kroupa and Salpeter IMF are marked by dashed horizontal lines, and the dotted line marks the fdg for an MW-like IMF in the model.
Current usage metrics show cumulative count of Article Views (full-text article views including HTML views, PDF and ePub downloads, according to the available data) and Abstracts Views on Vision4Press platform.
Data correspond to usage on the plateform after 2015. The current usage metrics is available 48-96 hours after online publication and is updated daily on week days.
Initial download of the metrics may take a while.