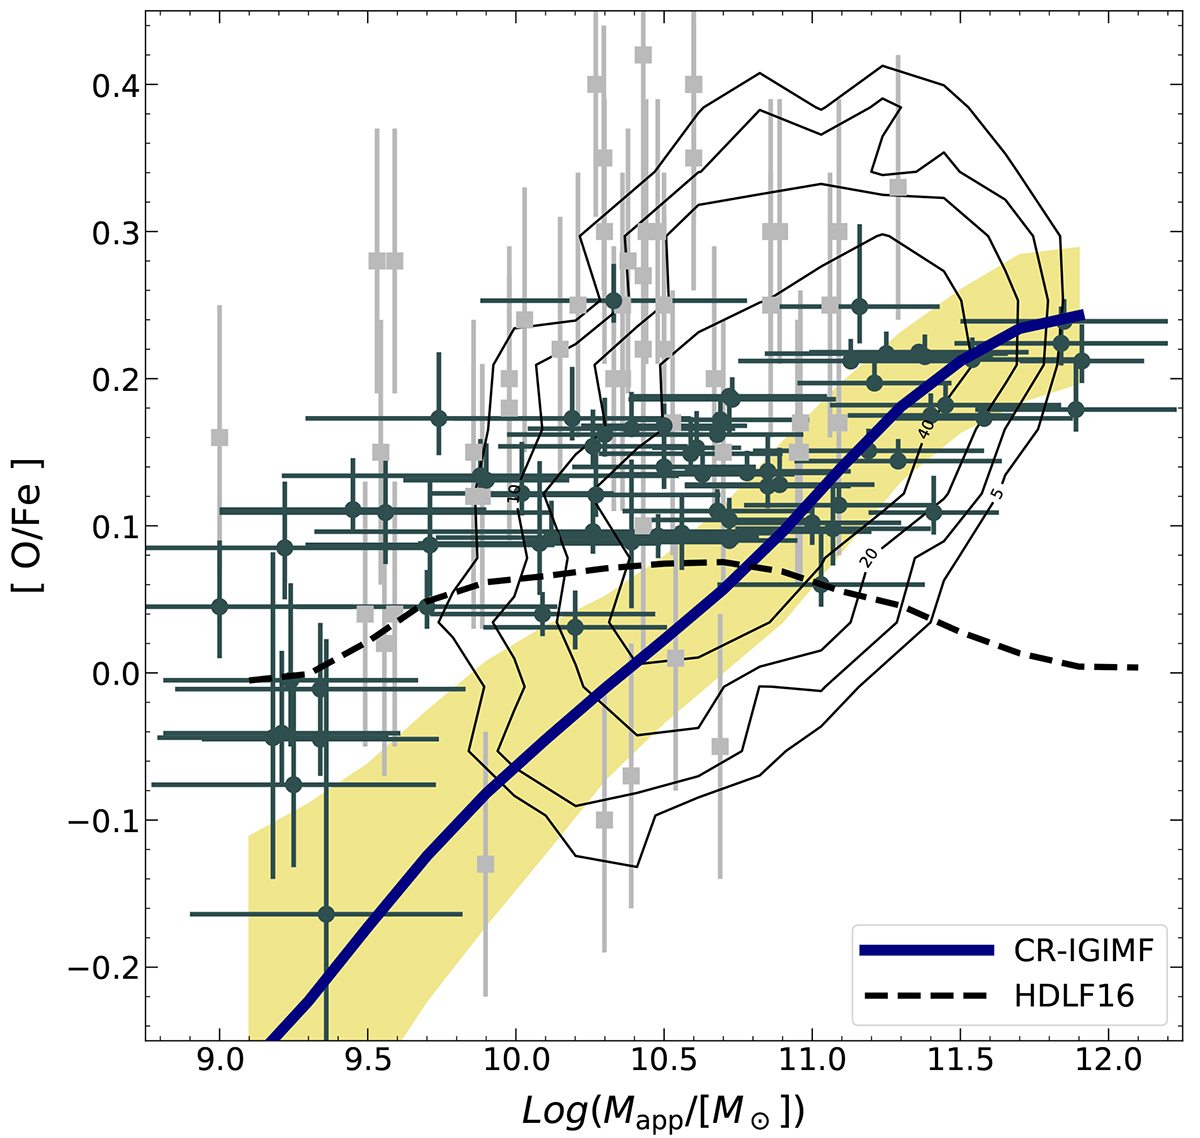
Fig. 5.
Download original image
[O/Fe] ratios in GAEA realization. The blue lines refer to the predictions of the CR-IGIMF, and the shaded area corresponds to the 15−85th percentiles. As reference, the dashed black lines show predictions from the HDLF16 model. Only model ETGs (i.e., B/T > 0.7) were considered. The observational constraints are taken from Thomas et al. (2010, contours), Arrigoni et al. (2010, dark gray circles), Spolaor et al. (2010, light gray squares).
Current usage metrics show cumulative count of Article Views (full-text article views including HTML views, PDF and ePub downloads, according to the available data) and Abstracts Views on Vision4Press platform.
Data correspond to usage on the plateform after 2015. The current usage metrics is available 48-96 hours after online publication and is updated daily on week days.
Initial download of the metrics may take a while.