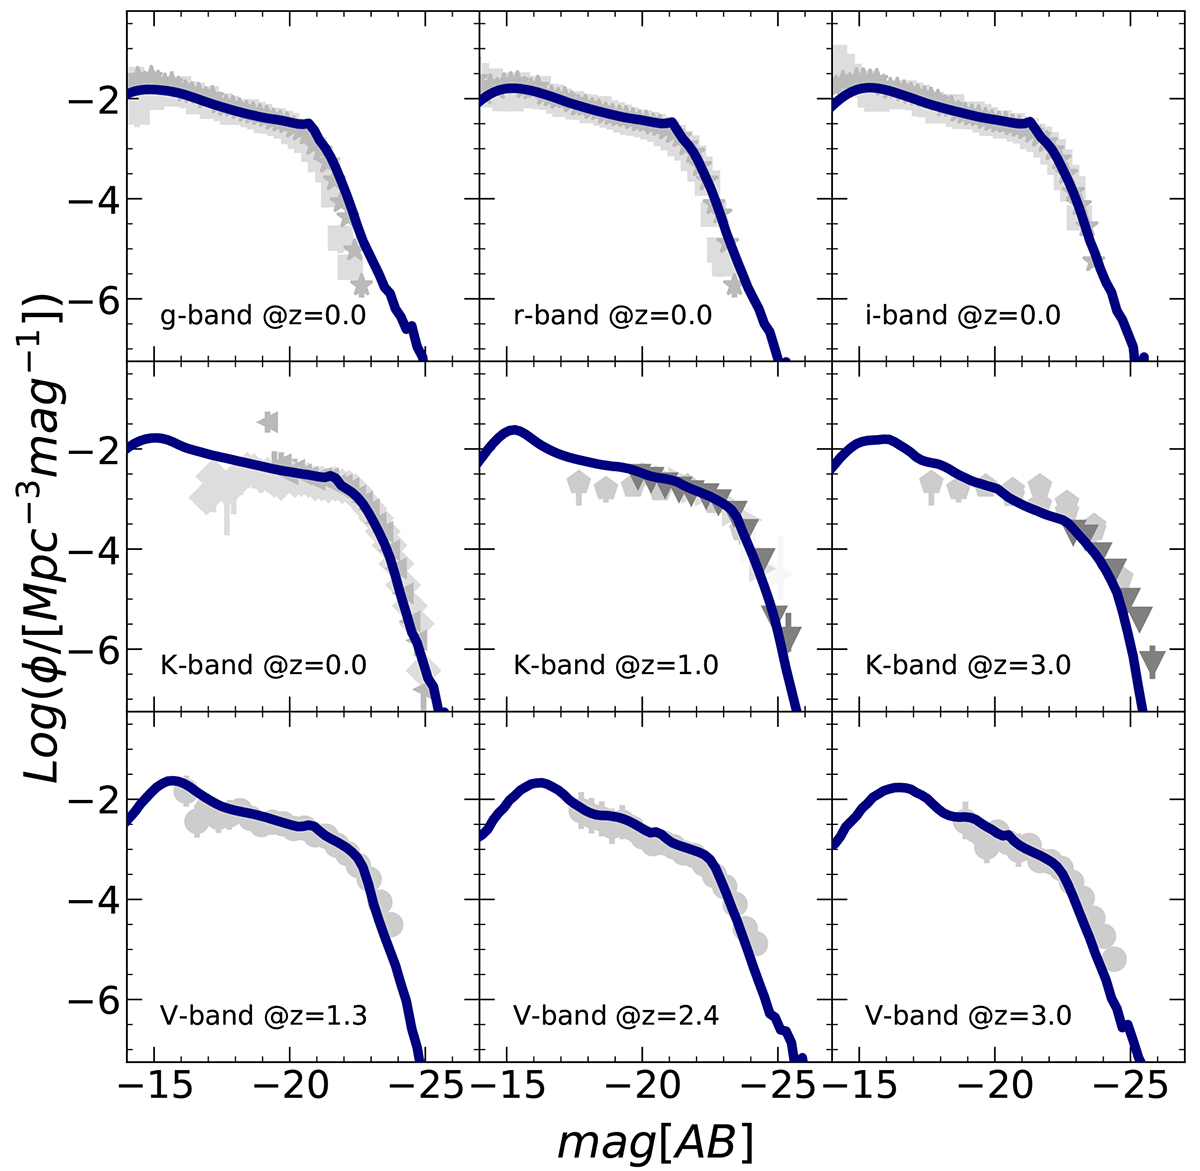
Fig. 1.
Download original image
Calibration set used for the CR-IGIMF run. The gray points represent the galaxy luminosity functions in different wavebands and at different redshifts, including the SDSS g, r, and i band, K, and V band (the same compilation of observational estimates used in F17 and F18a; see these papers for detailed references). In all panels, the blue line refers to the reference model predictions.
Current usage metrics show cumulative count of Article Views (full-text article views including HTML views, PDF and ePub downloads, according to the available data) and Abstracts Views on Vision4Press platform.
Data correspond to usage on the plateform after 2015. The current usage metrics is available 48-96 hours after online publication and is updated daily on week days.
Initial download of the metrics may take a while.