Fig. 9.
Download original image
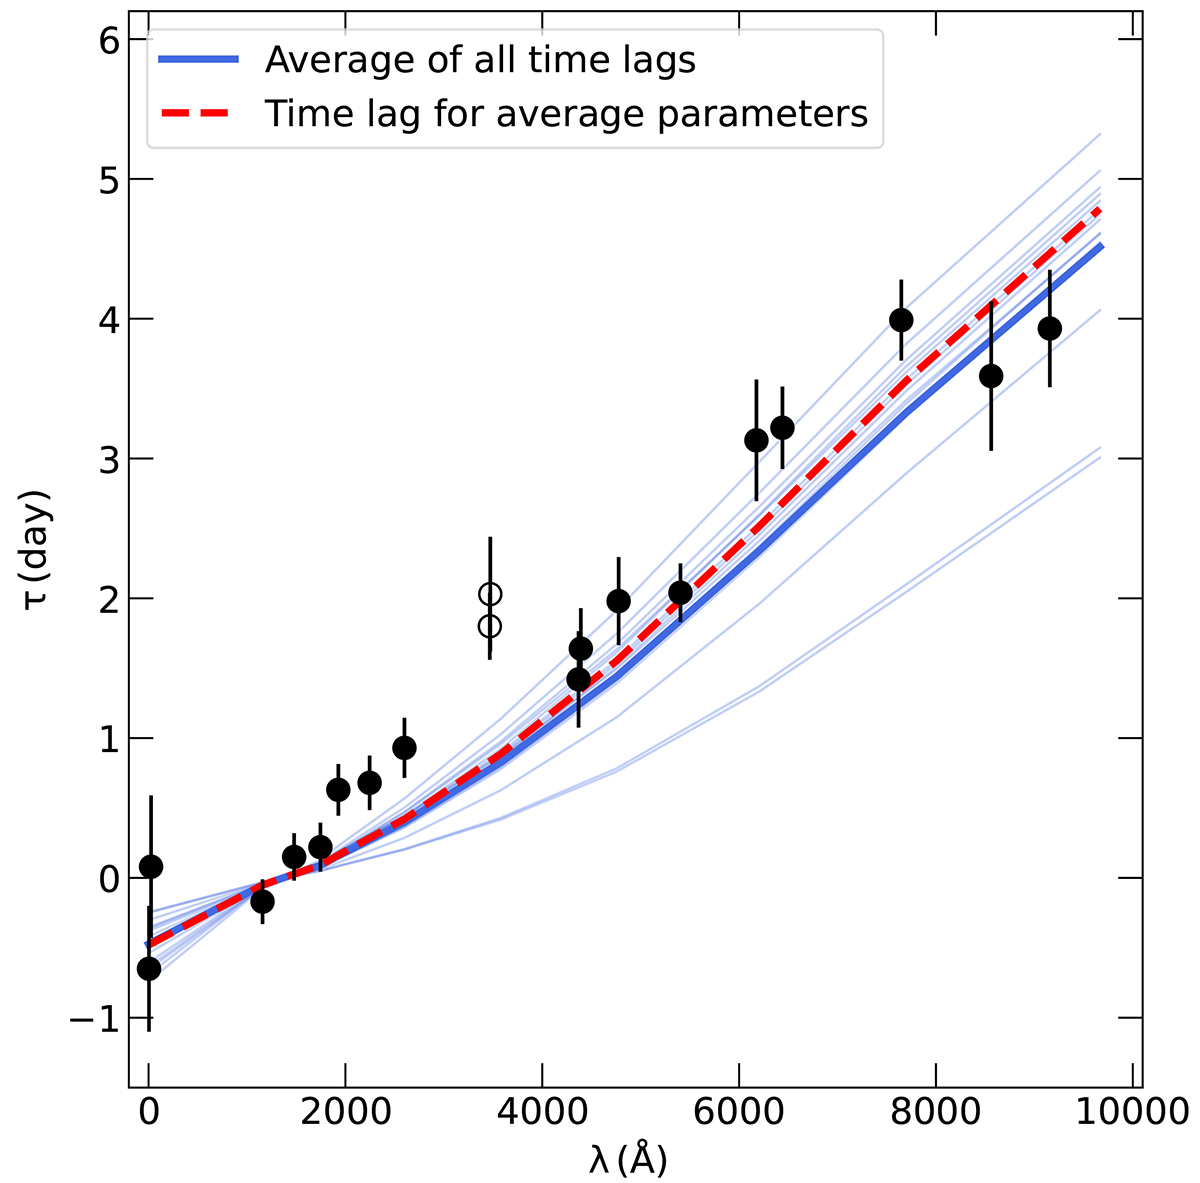
Model time lags obtained by considering the best-fit parameters from the 15 SEDs of NGC 5548 (thin blue lines). The thick blue line correspond to the average of the 15 time-lag spectra. The dashed red line corresponds to the time lag spectrum obtained by considering the average values of the best-fitted parameters obtained by modelling the variable SEDs. The black circles are the observed continuum time lags of NGC 5548. We show as empty black circles the measurements that are expected to be affected by the continuum emission from the broad-line region resulting in an excess in the delay.
Current usage metrics show cumulative count of Article Views (full-text article views including HTML views, PDF and ePub downloads, according to the available data) and Abstracts Views on Vision4Press platform.
Data correspond to usage on the plateform after 2015. The current usage metrics is available 48-96 hours after online publication and is updated daily on week days.
Initial download of the metrics may take a while.