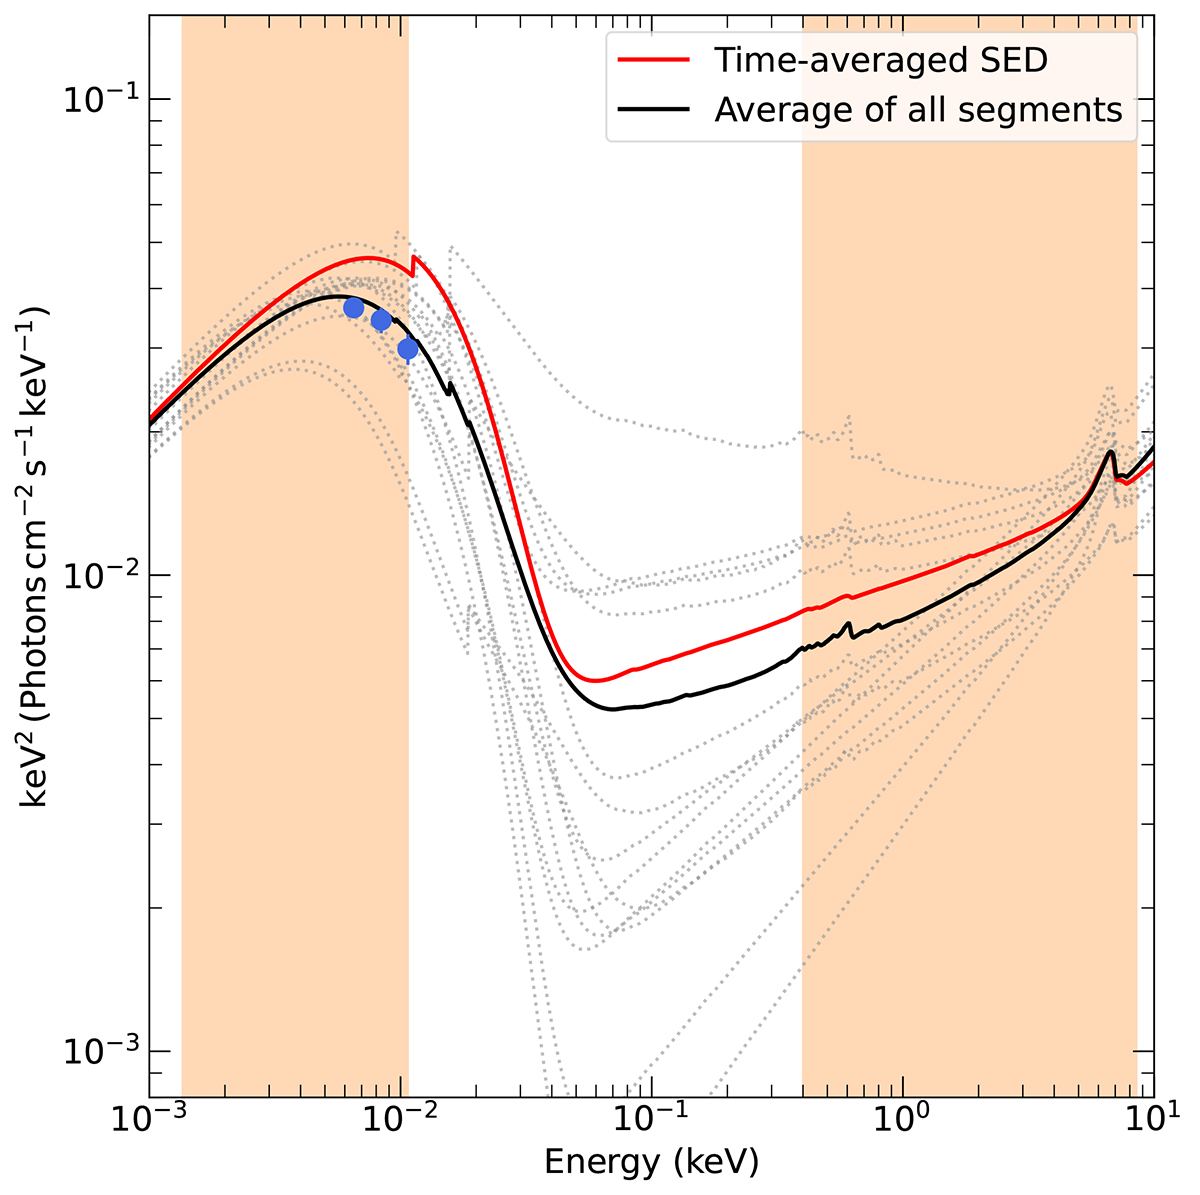
Fig. 7.
Download original image
Best-fit model SEDs to the 15 spectra of NGC 5548 (dotted grey lines). The solid black line shows the average of the 15 SEDs. The solid red line corresponds to the best-fit model to the time-averaged SED. Blue circles indicate the average flux of the 15 segments in the UV bands. The orange shaded areas highlight the energy ranges used to fit the time-averaged SED.
Current usage metrics show cumulative count of Article Views (full-text article views including HTML views, PDF and ePub downloads, according to the available data) and Abstracts Views on Vision4Press platform.
Data correspond to usage on the plateform after 2015. The current usage metrics is available 48-96 hours after online publication and is updated daily on week days.
Initial download of the metrics may take a while.