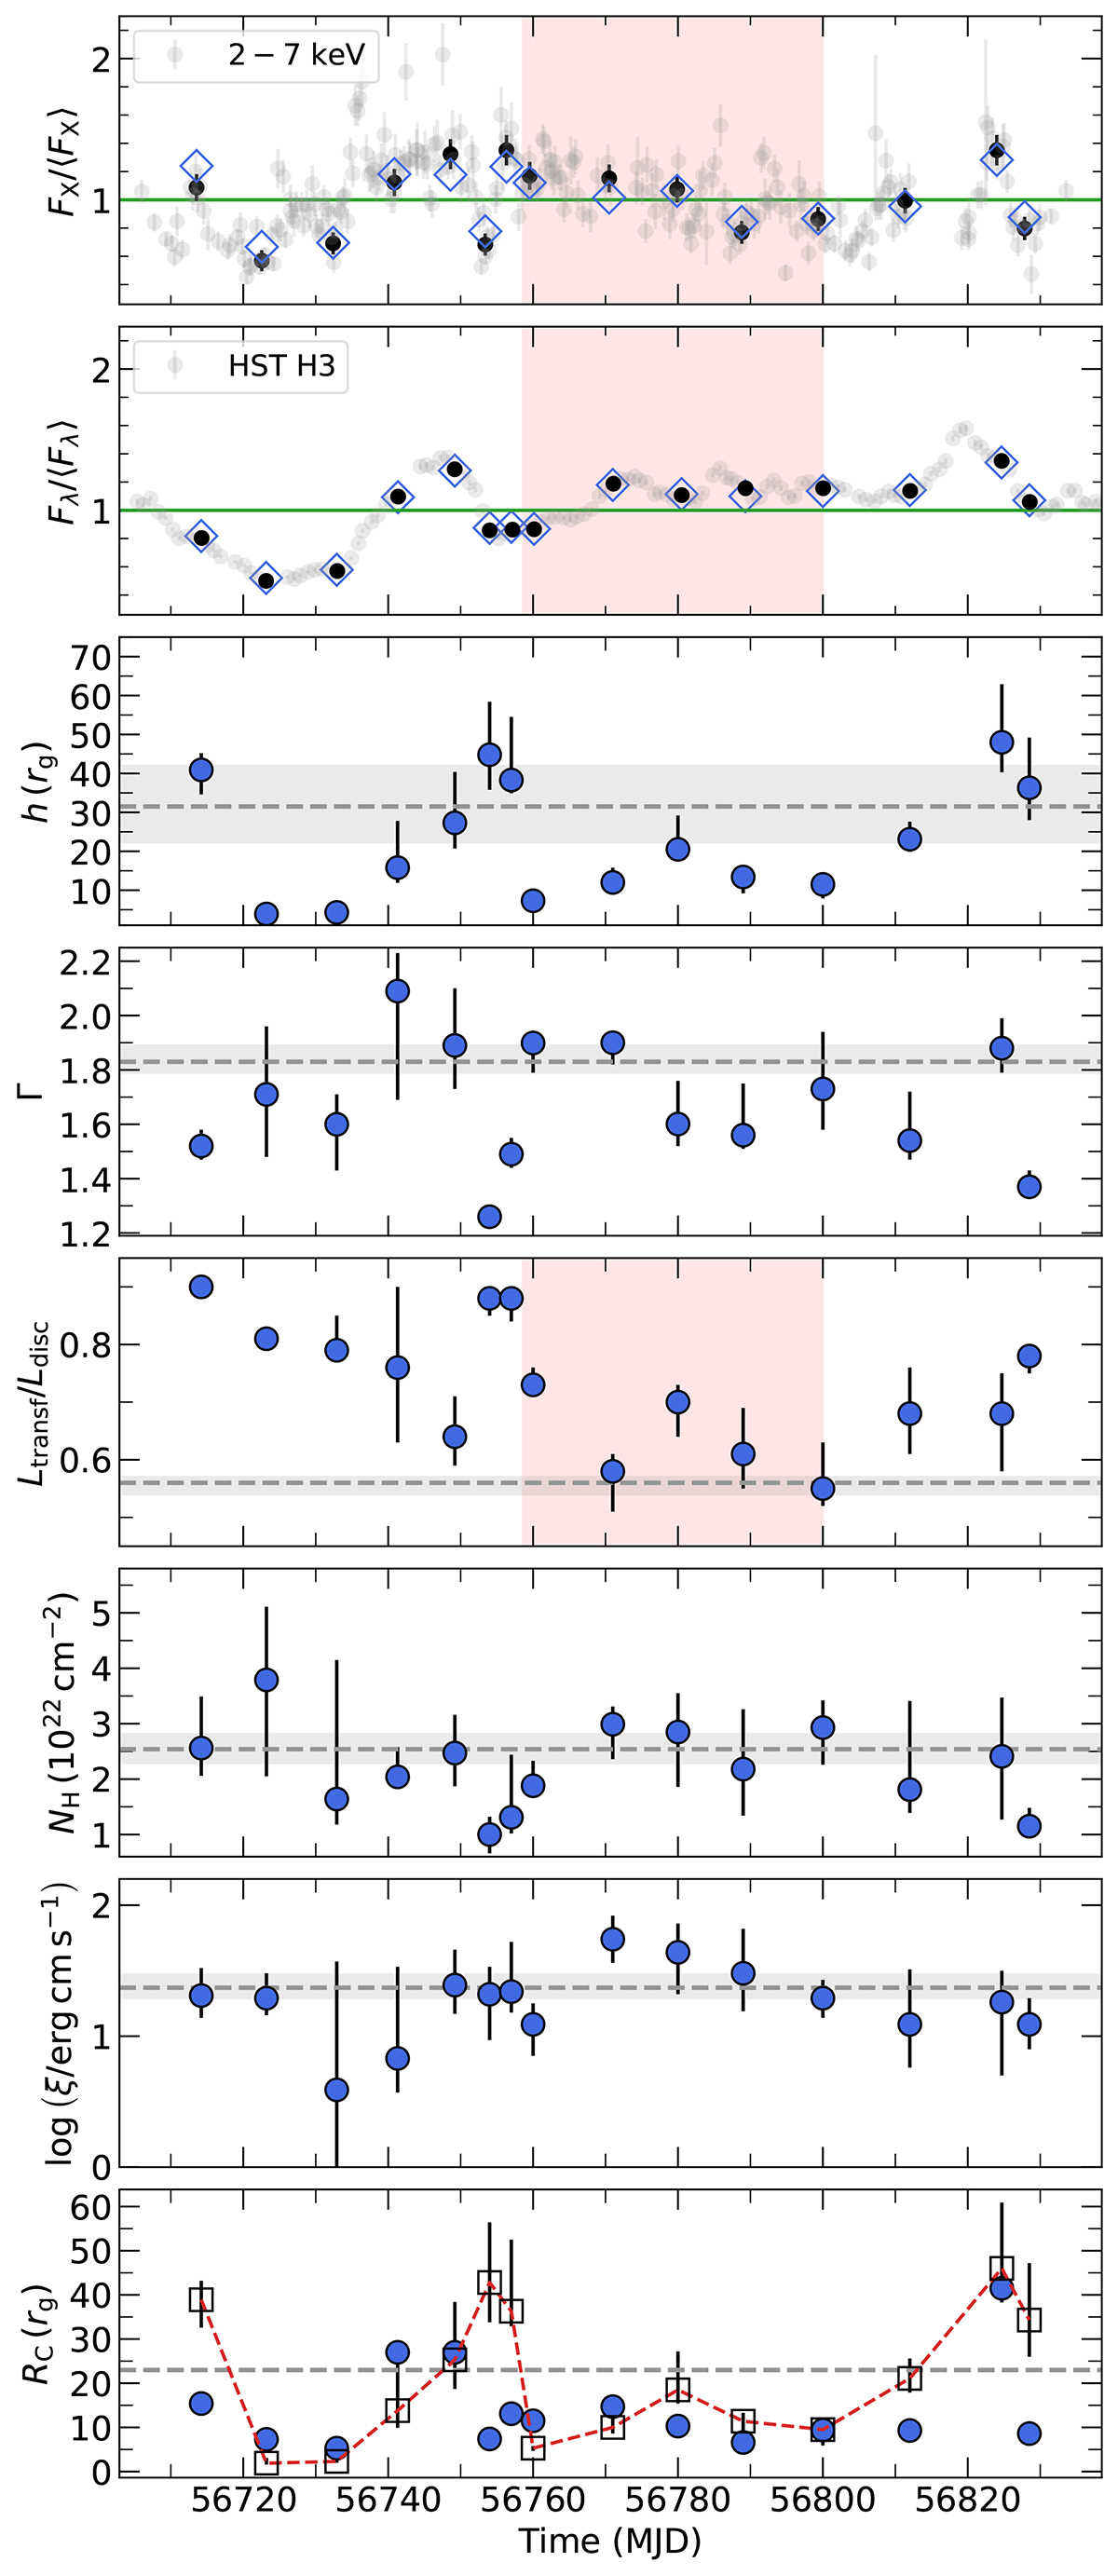
Fig. 6.
Download original image
Evolution of the best-fit parameters as fuction of time. Top two panels show the observed and the best-fit model-predicted X-ray and UV light curves (top and bottom panels, respectively). Grey circles show the mean count rate from all observations, while the black circles indicate the average count rate in each of the 15 time segments we computed the SEDs. Blue diamonds indicate the best-fit flux in each band, during the same segments. All fluxes and the black circles count rates are normalised to their respective mean. The bottom six panels show the evolution of the best-fit parameters as a function of time. The horizontal grey dashed lines and shaded areas correspond to the best-fit parameters (and the corresponding uncertainty) obtained by fitting the time-averaged SED in Sect. 2. Blue circles in the bottom panel show the corona radius, and the empty black squares indicate the difference between the height of the corona and the event horizon radius (errors on these points take into account only the error on the height). The red shaded area highlights the s8–s12 period in which Ltransf/Ldisc is the main driver of the variability (see Sect. 4.1 for more details).
Current usage metrics show cumulative count of Article Views (full-text article views including HTML views, PDF and ePub downloads, according to the available data) and Abstracts Views on Vision4Press platform.
Data correspond to usage on the plateform after 2015. The current usage metrics is available 48-96 hours after online publication and is updated daily on week days.
Initial download of the metrics may take a while.