Fig. 3.
Download original image
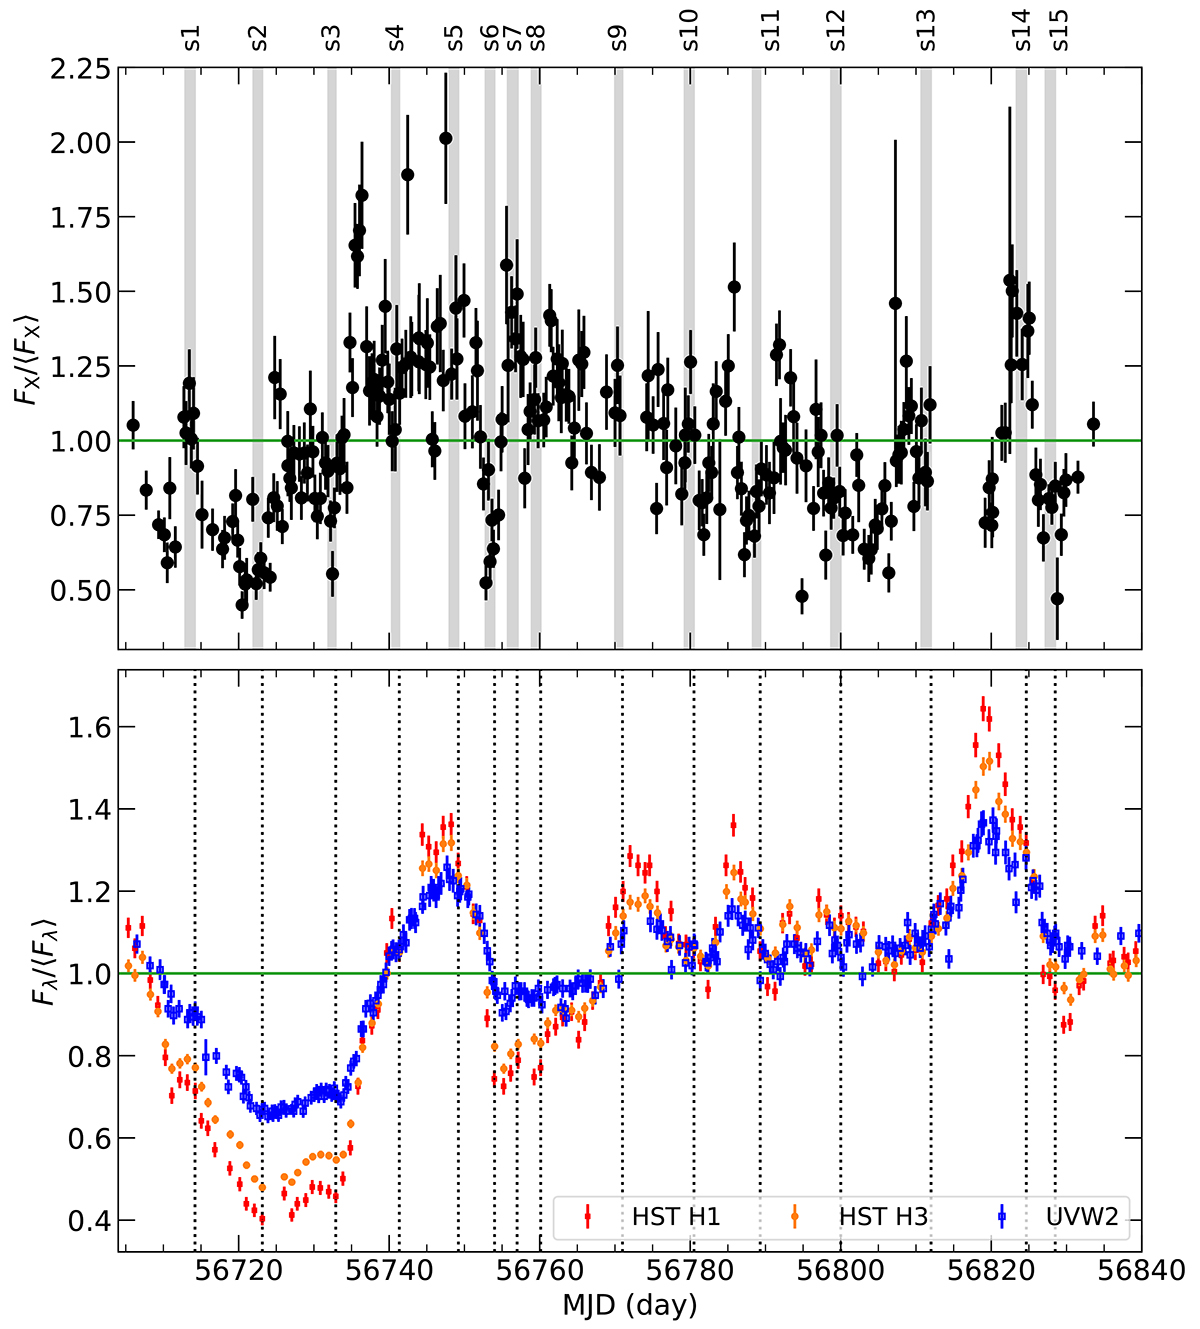
Mulit-wavelength light curves of NGC 5548. Top and bottom panels: the observed X-ray and UV light curves normalised to their mean (H1, H3, and UVW2 bands are plotted in red, orange, and blue points, respectively). The vertical dotted lines indicate the times at which we selected the UV data points. The grey shaded areas show the corresponding time intervals over which we integrated the X-ray spectrum (see text for details).
Current usage metrics show cumulative count of Article Views (full-text article views including HTML views, PDF and ePub downloads, according to the available data) and Abstracts Views on Vision4Press platform.
Data correspond to usage on the plateform after 2015. The current usage metrics is available 48-96 hours after online publication and is updated daily on week days.
Initial download of the metrics may take a while.