Fig. 2.
Download original image
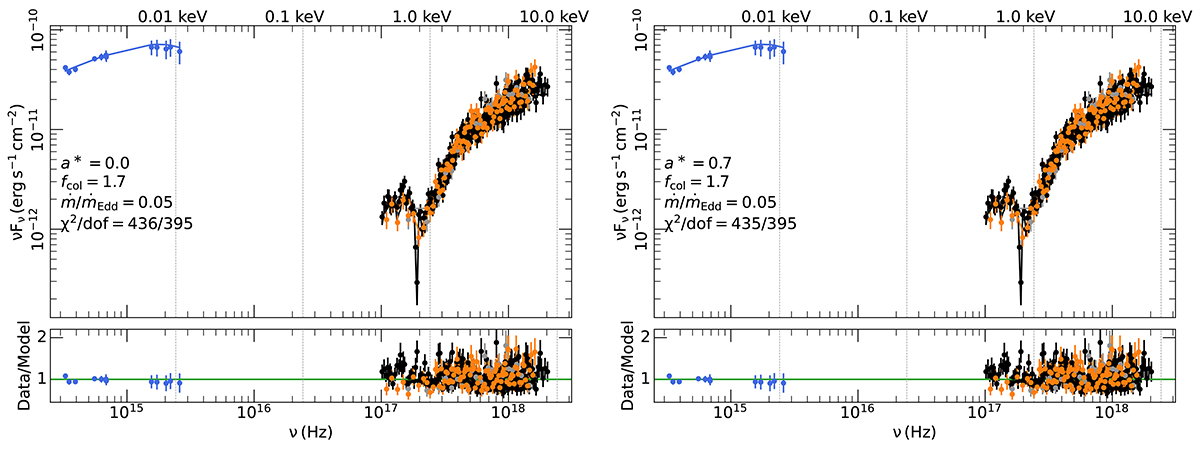
Time-averaged SED of NGC 5548 fitted with Case 1 and Case 3 models, using the best-fit parameters listed in Table 2 (see Sect. 2 for details). The blue data points correspond to the UV/optical data, the black, grey, and orange data points correspond to the Swift/XRT spectra extracted from three different time intervals that are consistent with the average X-ray flux. The bottom panels show the corresponding data-to-model ratios.
Current usage metrics show cumulative count of Article Views (full-text article views including HTML views, PDF and ePub downloads, according to the available data) and Abstracts Views on Vision4Press platform.
Data correspond to usage on the plateform after 2015. The current usage metrics is available 48-96 hours after online publication and is updated daily on week days.
Initial download of the metrics may take a while.