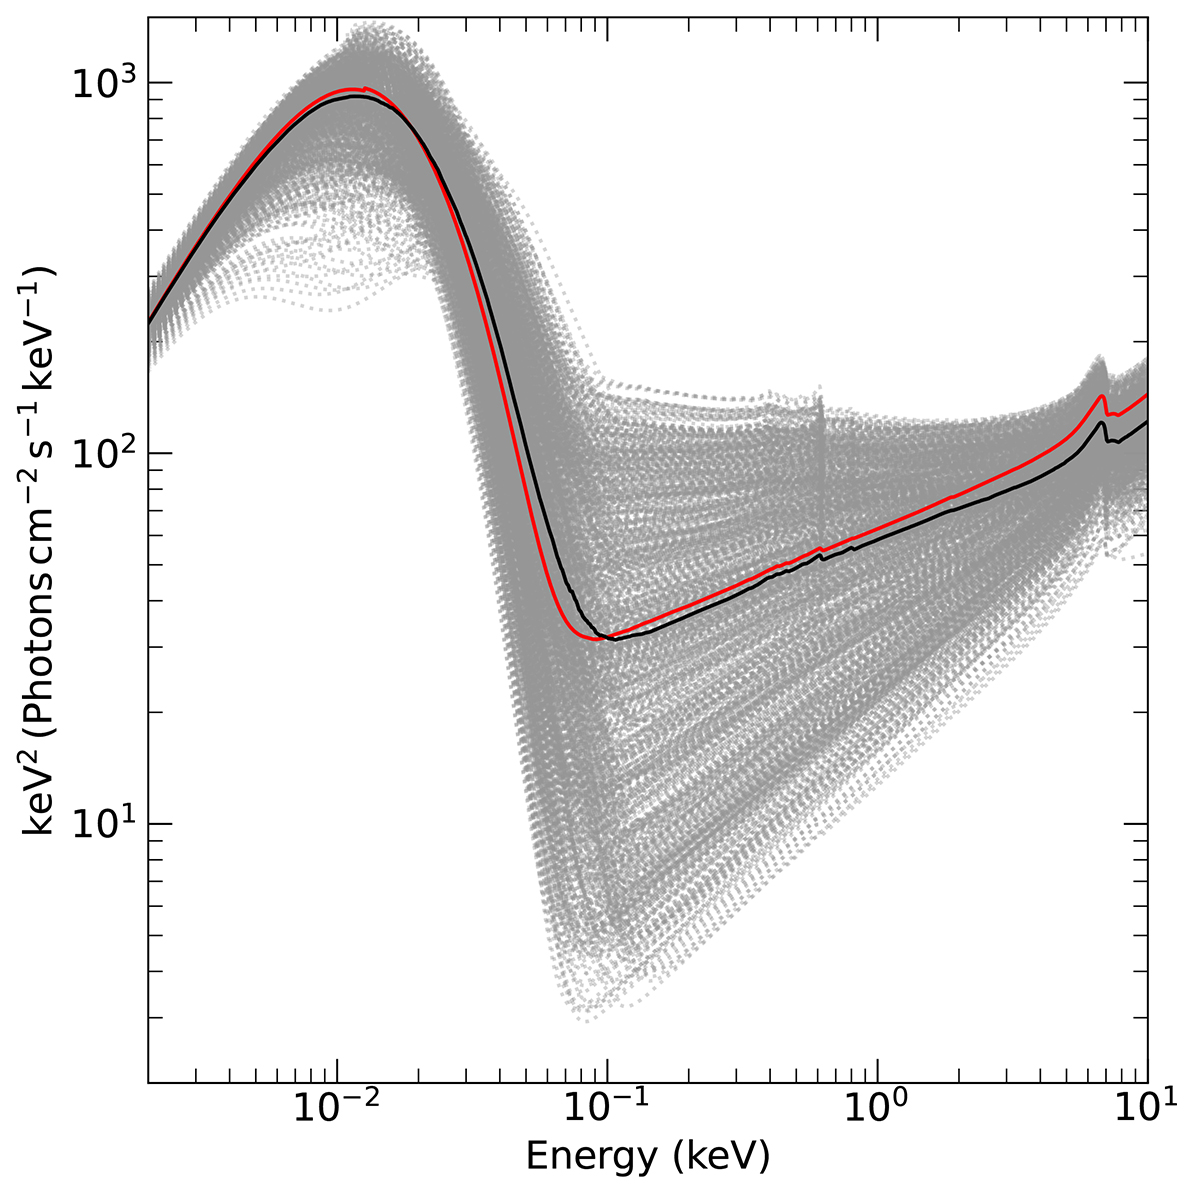
Fig. 1.
Download original image
Model SEDs estimated by choosing randomly 1000 values of h, Γ, and Ltransf/Ldisc (see Sect. 2.1). The individual realisations are shown as grey dotted lines. The black solid line correspond to the median of all 1000 SEDs. The red line corresponds to the SED estimated by considering the average values of h, Γ, and Ltransf/Ldisc.
Current usage metrics show cumulative count of Article Views (full-text article views including HTML views, PDF and ePub downloads, according to the available data) and Abstracts Views on Vision4Press platform.
Data correspond to usage on the plateform after 2015. The current usage metrics is available 48-96 hours after online publication and is updated daily on week days.
Initial download of the metrics may take a while.