Fig. 8.
Download original image
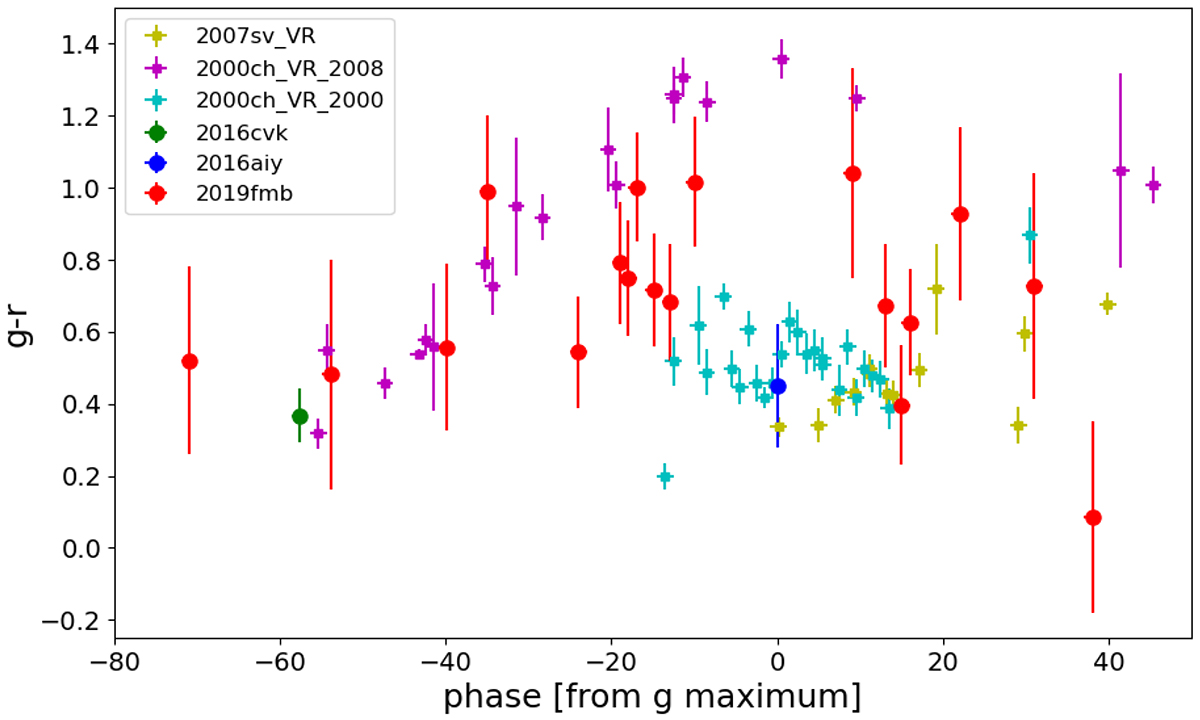
g − r colour of the three pre-SN outbursts or activities for which multi-band photometry is available. The phases are relative to the maximum in the r-band, which was derived from a Gaussian fit over the data points. For comparison, the V − R colour of the 2000 and 2008 outbursts of the known LBV AT 2000ch (Pastorello et al. 2010) and of the SN impostor SN 2007sv (Tartaglia et al. 2015) are also shown. The g − r colour of the outbursts is red, around g − r∼0.5 mag.
Current usage metrics show cumulative count of Article Views (full-text article views including HTML views, PDF and ePub downloads, according to the available data) and Abstracts Views on Vision4Press platform.
Data correspond to usage on the plateform after 2015. The current usage metrics is available 48-96 hours after online publication and is updated daily on week days.
Initial download of the metrics may take a while.