Open Access
Fig. 7.
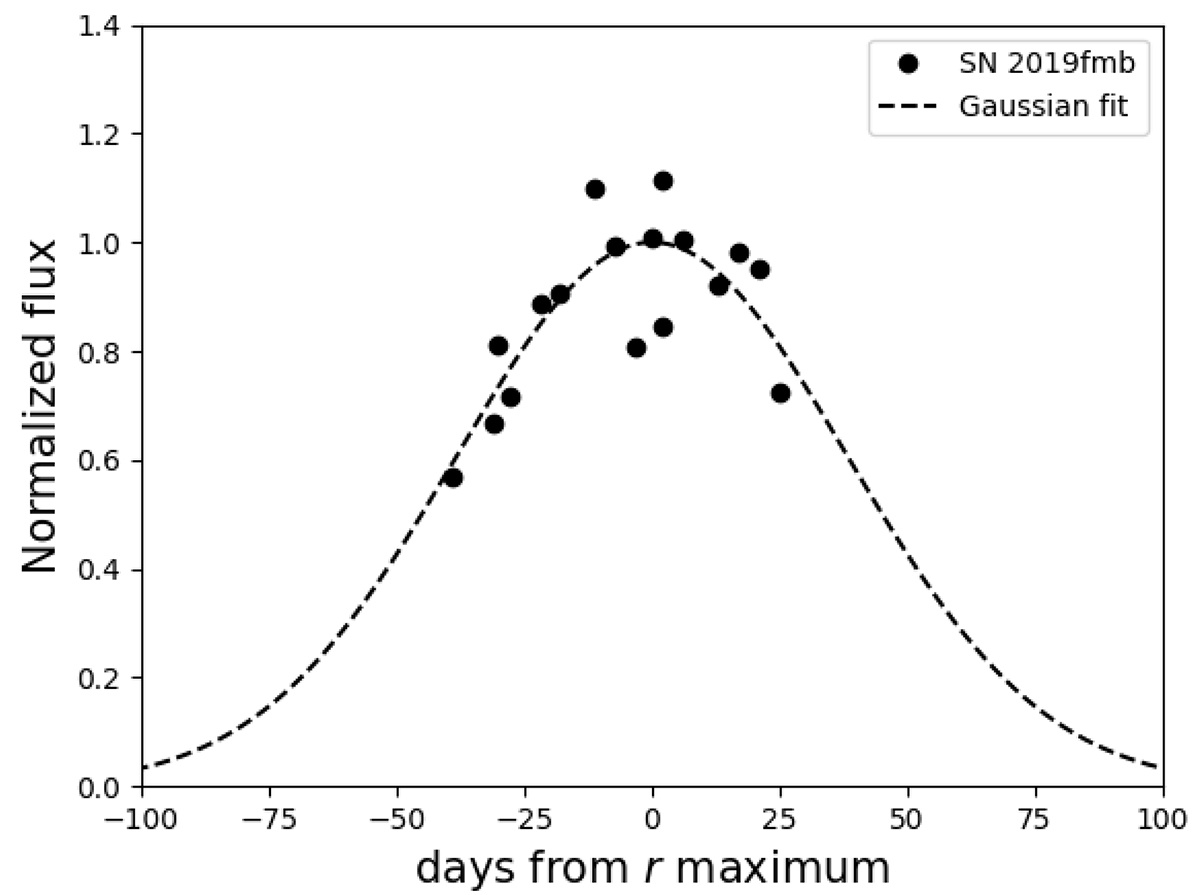
Download original image
Gaussian fit (dashed line) over the r-band light curve of the pre-SN outburst before SN 2019fmb. The magnitudes of the data points were converted into fluxes, and then normalised with respect to the peak of the Gaussian fit and centred on the epoch of the maximum.
Current usage metrics show cumulative count of Article Views (full-text article views including HTML views, PDF and ePub downloads, according to the available data) and Abstracts Views on Vision4Press platform.
Data correspond to usage on the plateform after 2015. The current usage metrics is available 48-96 hours after online publication and is updated daily on week days.
Initial download of the metrics may take a while.