Fig. 6.
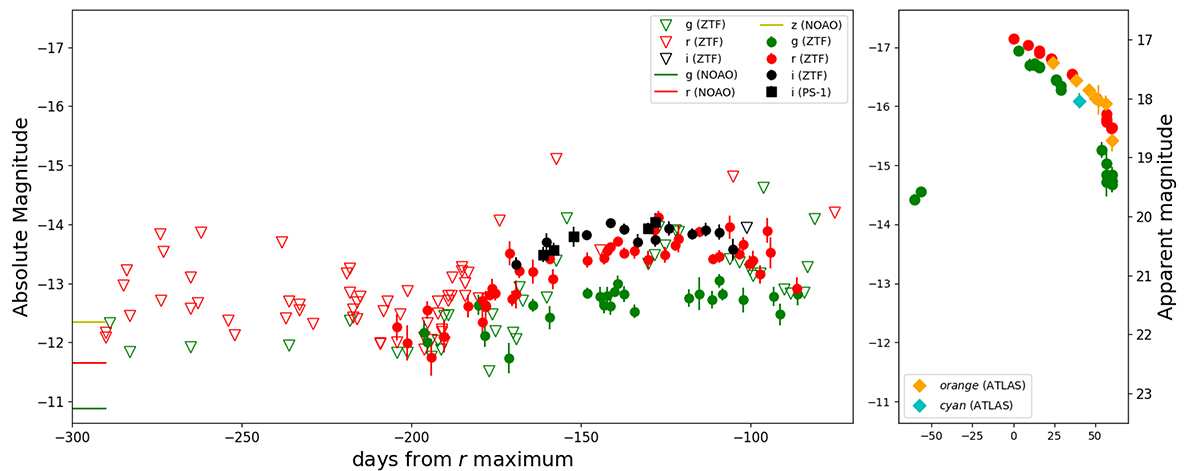
Download original image
Pre- and post-explosion light curves of SN 2019fmb. Left: Pre- and post-discovery (MJD = 58 615) Sloan-gri detections from the ZTF and PS-1 surveys of SN 2019fmb. Observations from different instruments are plotted with different symbols. The phases are relative to the brightest r-band point in the SN light curve. The deepest upper limits of the object in g-, r- and z-band filters from NOAO archival data of 2016 are marked with horizontal lines in the bottom-left corner. Right: Light curve of SN 2019fmb, with the detections by ATLAS also reported. As for SN 2019bxq, the SN has a short duration.
Current usage metrics show cumulative count of Article Views (full-text article views including HTML views, PDF and ePub downloads, according to the available data) and Abstracts Views on Vision4Press platform.
Data correspond to usage on the plateform after 2015. The current usage metrics is available 48-96 hours after online publication and is updated daily on week days.
Initial download of the metrics may take a while.