Fig. 5.
Download original image
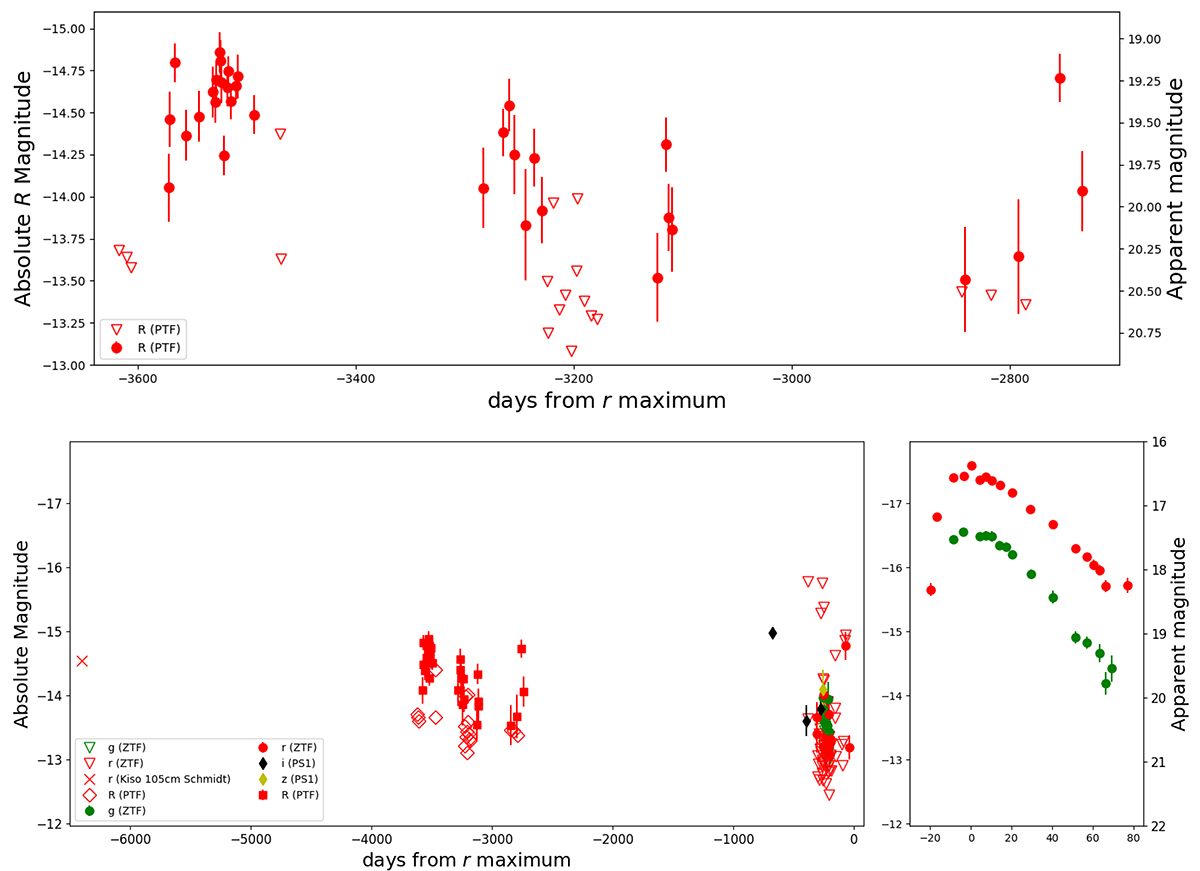
Pre- and post-explosion light curves of SN 2019bxq. Top: Pre-explosion R-band absolute light curve of SN 2019bxq from the PTF survey. The data span the 2009–2011 period. The magnitudes are corrected for the adopted distance modulus and Galactic reddening. The phase on the x-axis is from the SN r-band maximum (MJD = 58577). The open inverted triangles mark upper limits (i.e. non-detections). Bottom left: Same as above, but including all the available data (PTF+ZTF+sparse archive data). Observations from different instruments are plotted with different symbols. The phases are relative to the brightest r-band point in the SN light curve. Bottom right: Post-explosion g- and r-band light curves of SN 2019bxq from the ZTF survey. The SN light curves are shown to highlight the short duration of the SN event.
Current usage metrics show cumulative count of Article Views (full-text article views including HTML views, PDF and ePub downloads, according to the available data) and Abstracts Views on Vision4Press platform.
Data correspond to usage on the plateform after 2015. The current usage metrics is available 48-96 hours after online publication and is updated daily on week days.
Initial download of the metrics may take a while.