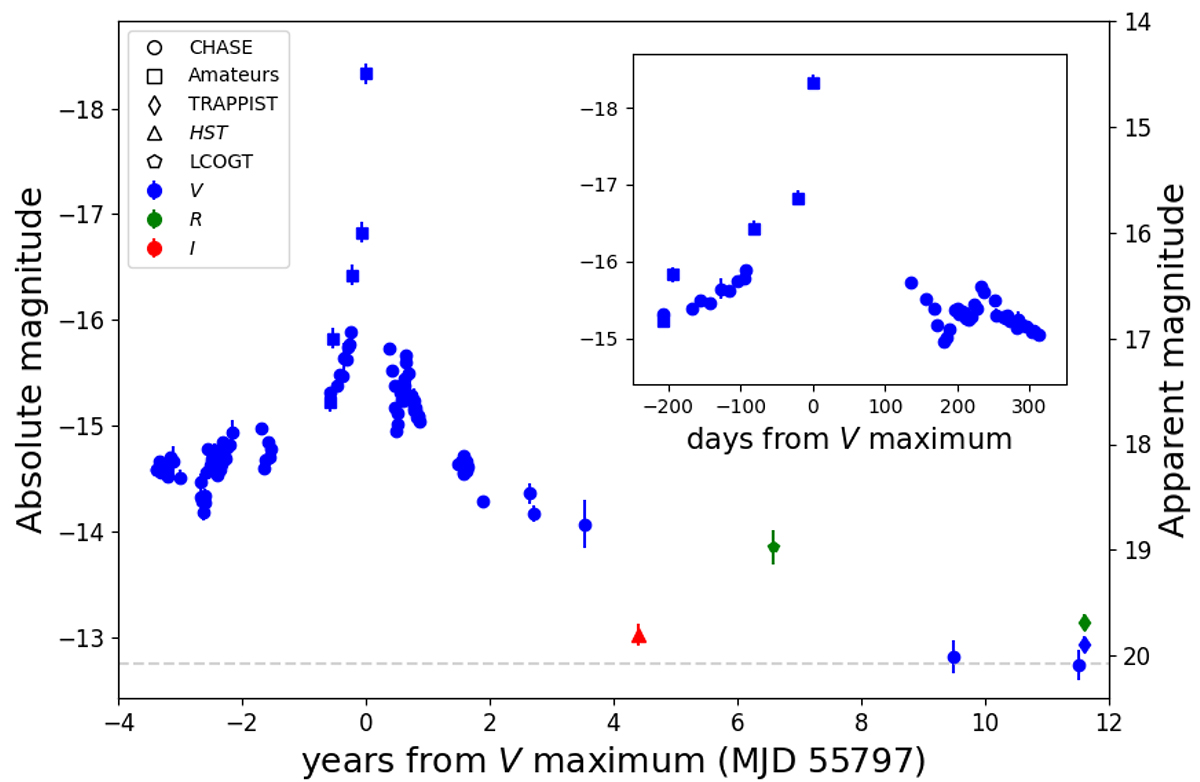
Fig. 1.
Download original image
Pre- and post-discovery observation of SN 2011fh. Clear filter magnitudes from the CHASE Survey and from amateurs are plotted as V-band, a single w-band LCOGT observation as R-band, and the 2016 HST F814W observation as I-band. Observations from different instruments are plotted with different symbols. The late-time luminosity level is marked with a dashed line. A zoom onto the rise to the 2011 event is plotted in the inset window, showing the first year of decline, during which a second, smaller peak is visible at +250 days.
Current usage metrics show cumulative count of Article Views (full-text article views including HTML views, PDF and ePub downloads, according to the available data) and Abstracts Views on Vision4Press platform.
Data correspond to usage on the plateform after 2015. The current usage metrics is available 48-96 hours after online publication and is updated daily on week days.
Initial download of the metrics may take a while.