Fig. B.1
Download original image
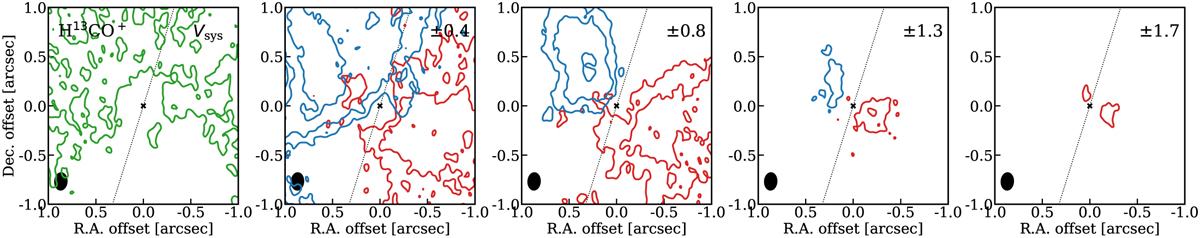
Channel maps of H13CO+ 4-3. To create this image the cube was re-binned in the spectral axis by a factor of two to increase the S/N. The contours are at levels [6, 9, 14]σ, where σ of this re-binned cube is equal to 1.8 mJy beam−1. The red and blue contours correspond to positive and negative velocities respectively, expressed in km s−1 with respect to the adopted systemic velocity Vsys (= 5.3 km s−1 in the LSR frame). The peak of the continuum is indicated by a cross and the jet axis by a dotted line.
Current usage metrics show cumulative count of Article Views (full-text article views including HTML views, PDF and ePub downloads, according to the available data) and Abstracts Views on Vision4Press platform.
Data correspond to usage on the plateform after 2015. The current usage metrics is available 48-96 hours after online publication and is updated daily on week days.
Initial download of the metrics may take a while.