Fig. 4
Download original image
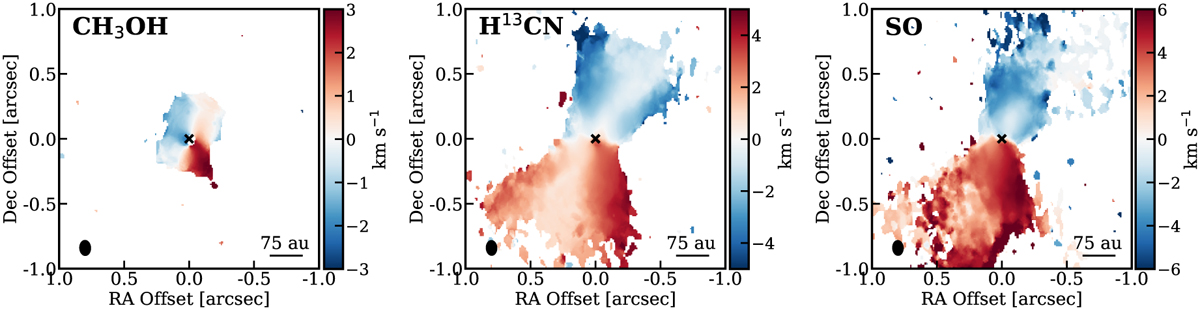
Moment 1 (intensity-weighted velocity) maps of CH3OH (22,1,0−31,2,0), H13CN (4−3), and SO (89−78) demonstrating rotation in their low-velocity outflow component. The velocity ranges used to compute the maps are ±4, ±5, and ±8 km s−1 for CH3OH, H13CN, and SO, respectively, and a cut at ~3σ is made. The black cross in all panels indicates the continuum peak.
Current usage metrics show cumulative count of Article Views (full-text article views including HTML views, PDF and ePub downloads, according to the available data) and Abstracts Views on Vision4Press platform.
Data correspond to usage on the plateform after 2015. The current usage metrics is available 48-96 hours after online publication and is updated daily on week days.
Initial download of the metrics may take a while.