Fig. 1
Download original image
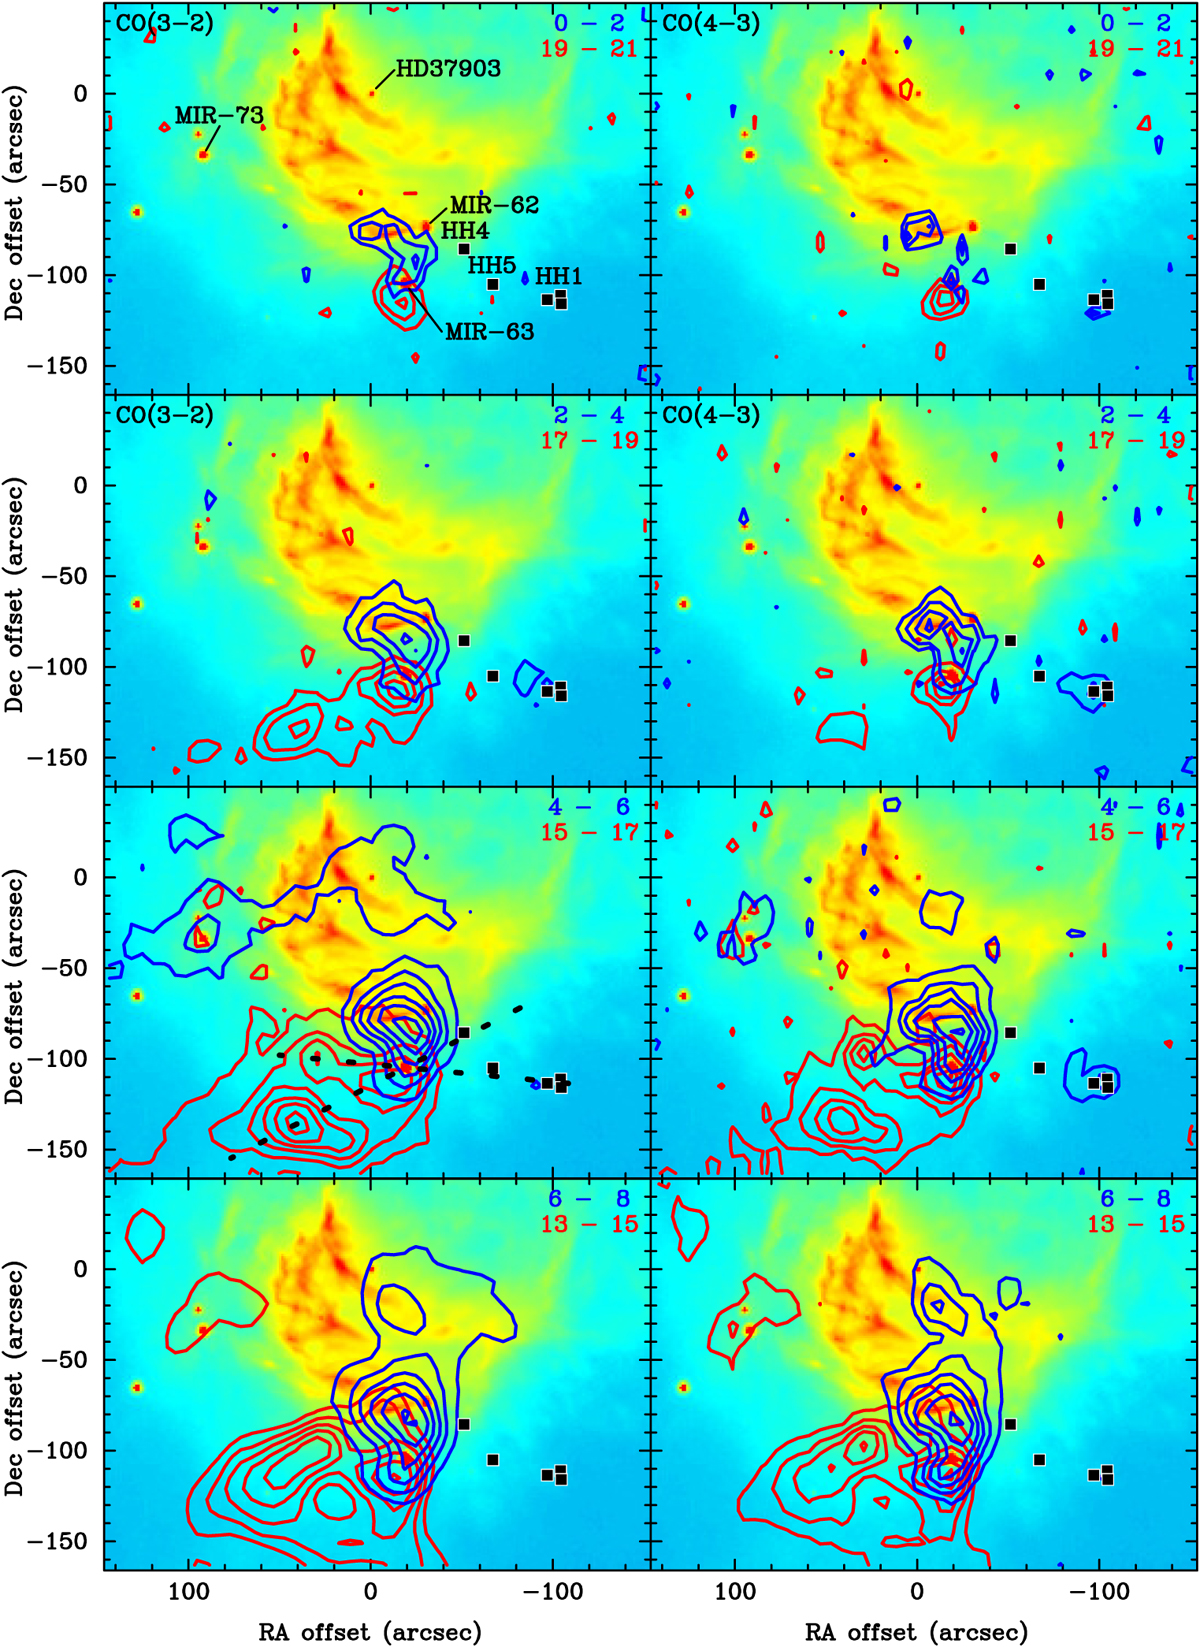
Contours of high-velocity CO emission plotted in 2 km s−1 wide intervals from a center velocity of 10.5 km s−1 and overlaid on the 8 µm IRAC image in color. HD 37903 is at an offset 0″, 0″. The left panels show high-velocity emission in CO(3−2), and the right panels show this in CO(4−3). The blue- and redshifted velocity ranges for the CO emission are indicated in the top right corner in each plot. The positions of the young stars MIR-63, MIR-62, and MIR-73 are labeled in the top left panel, and the Herbig Haro objects are plotted with black squares. The hatched lines in the CO(3−2) panel for intermediate velocities are drawn to outline the bipolar outflow from MIR-63. The topmost panels show three linearly spaced contours from 0.4 K to 1.1 K in CO(3−2), and from 0.65 K to 1.68 K and 1.125 K in red- and blueshifted CO(4−3), respectively. At high velocities, ± 7.5 km s−1, we plot four contours the from 0.6 K for CO(3−2) and 0.7 K for CO(4−3), with the highest red and blue contours at 2.01 K and 2.41 K for CO(3−2) and 2.12 K and 2.46 K for CO(4−3). For low and intermediate velocities, we plot six contours starting at 0.8 K for both CO(3−2) and CO(4−3) at intermediate velocities, ± 5.5 km s−1, and at low velocities, ±3.5 km s−1. The contours start at 3 K and 2.5 K to avoid contamination from the molecular cloud. For intermediate velocities, the highest contours are at 6.1 K and 6.0 K and 4.9 K and 6.1 K for CO(3−2) and CO(4−3), and for low velocities, they are 11.6 K and 16.3 K and 12.0 K and 15.9 K for CO(3−2) and CO(4−3), respectively.
Current usage metrics show cumulative count of Article Views (full-text article views including HTML views, PDF and ePub downloads, according to the available data) and Abstracts Views on Vision4Press platform.
Data correspond to usage on the plateform after 2015. The current usage metrics is available 48-96 hours after online publication and is updated daily on week days.
Initial download of the metrics may take a while.