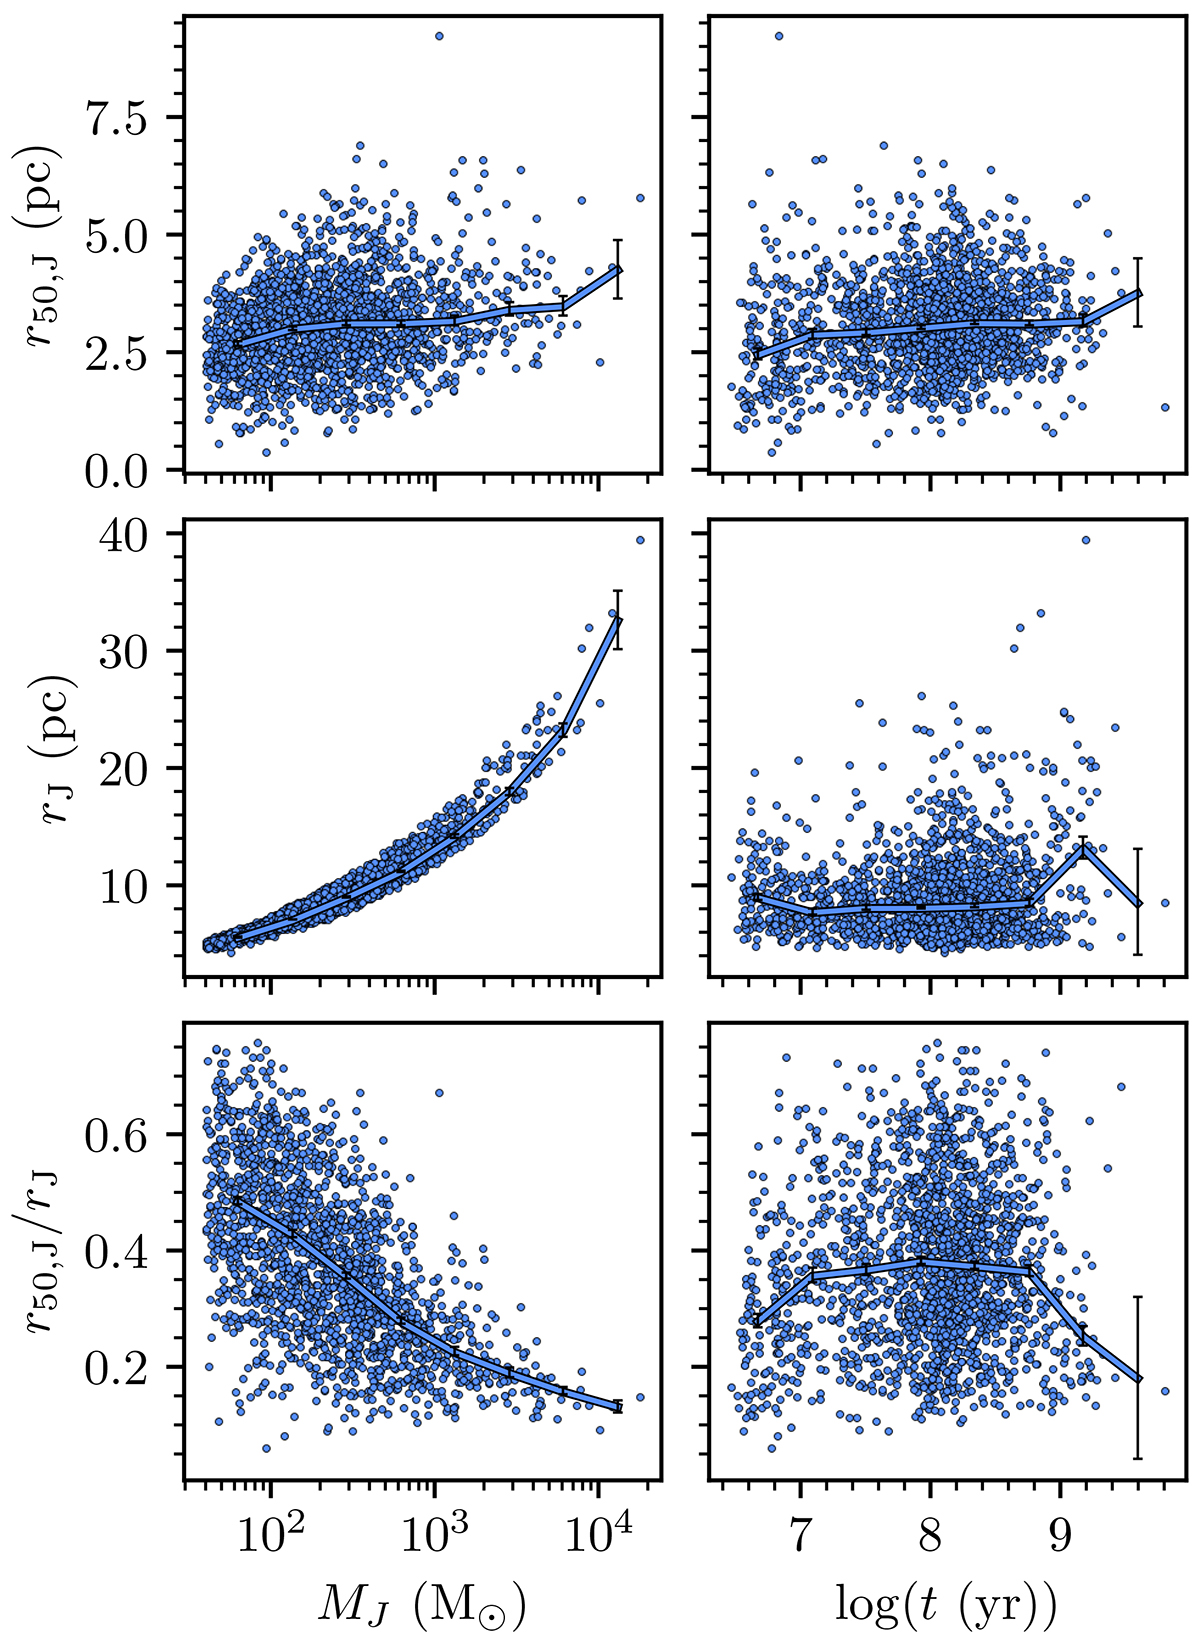
Fig. 9.
Download original image
Jacobi radii and concentrations of high-quality OCs within 2 kpc, shown for r50, J (upper row), rJ (middle row), and cluster concentrations r50, J/rJ (bottom row) against cluster Jacobi mass (left column) and cluster age (right column). In each panel, a trend line of binned medians is shown in blue, with error bars showing standard error.
Current usage metrics show cumulative count of Article Views (full-text article views including HTML views, PDF and ePub downloads, according to the available data) and Abstracts Views on Vision4Press platform.
Data correspond to usage on the plateform after 2015. The current usage metrics is available 48-96 hours after online publication and is updated daily on week days.
Initial download of the metrics may take a while.