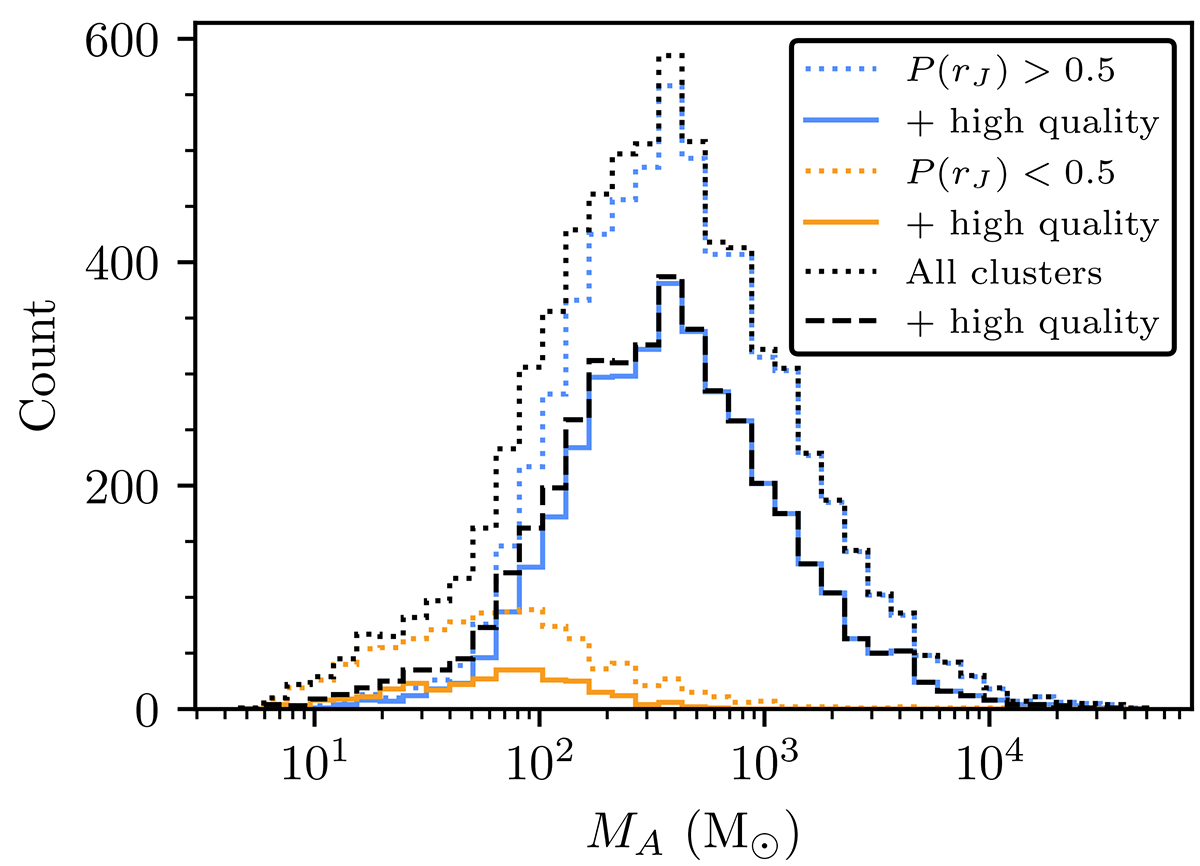
Fig. 8.
Download original image
Histogram of total cluster masses MA for all clusters divided into different samples. This is shown for all clusters (black dotted line), those with P(rJ) > 0.5 (blue dotted line), and those with P(rJ) < 0.5 (orange dotted line). The dashed and solid variants of these lines show the mass distribution for these clusters but restricted to only those in the high quality object sample. (Adapted from Hunt 2023.)
Current usage metrics show cumulative count of Article Views (full-text article views including HTML views, PDF and ePub downloads, according to the available data) and Abstracts Views on Vision4Press platform.
Data correspond to usage on the plateform after 2015. The current usage metrics is available 48-96 hours after online publication and is updated daily on week days.
Initial download of the metrics may take a while.