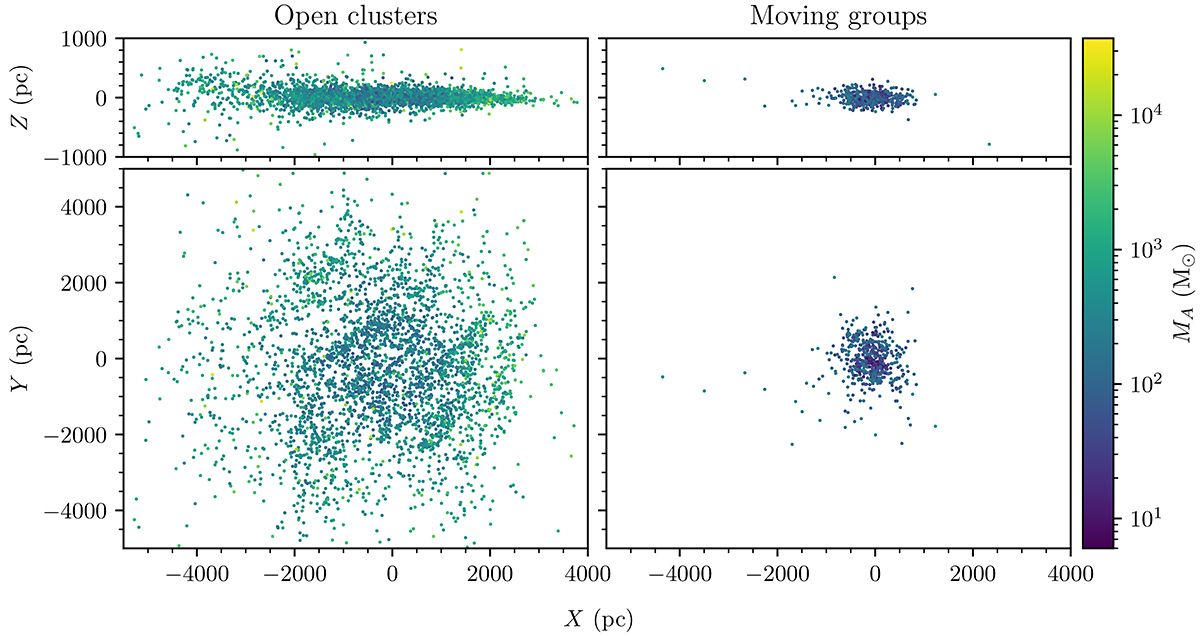
Fig. 7.
Download original image
Comparison of the spatial distribution of OCs and MGs. Left column: distribution in Cartesian heliocentric coordinates of 3530 OCs in the high quality sample of OCs from Table 3. The Sun is at X = Y = 0 pc, the galactic centre is to the right, and the Z axis denotes height above or below the plane. OCs are shaded by the mass of the entire detected cluster, including tidal tails. Right column: identical plot, but for 539 MGs in the high quality sample.
Current usage metrics show cumulative count of Article Views (full-text article views including HTML views, PDF and ePub downloads, according to the available data) and Abstracts Views on Vision4Press platform.
Data correspond to usage on the plateform after 2015. The current usage metrics is available 48-96 hours after online publication and is updated daily on week days.
Initial download of the metrics may take a while.