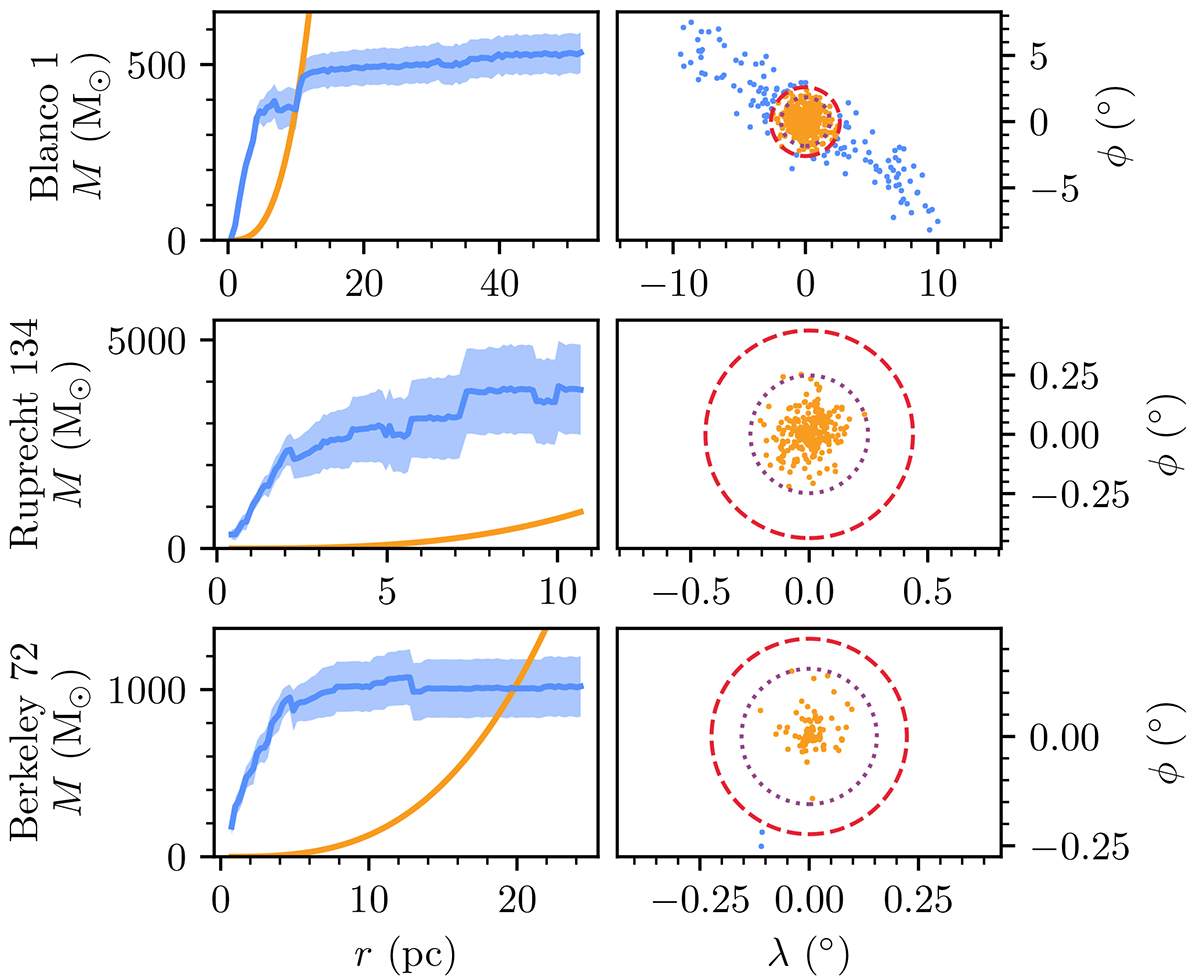
Fig. 4.
Download original image
Jacobi radius calculation method shown for the three OCs from Fig. 2, with each row corresponding to each OC. Within each row, the left panel shows the cluster mass as a function of radius from the centre of the cluster, where the blue line is our calculated total cluster mass with a shaded uncertainty region, and the orange line is the theoretical Jacobi mass for a cluster of that size given Eq. (2). The intersection of these lines is the cluster’s rJ. The right panel in each row shows the cluster in an arbitrary coordinate frame centred on the cluster centre. Member stars within rJ are shown in orange, with member stars outside of rJ shown in blue. rJ is indicated by the dashed red line. The dotted purple line denotes our approximate calculated King (1962) tidal radius for each cluster from Paper II. (Adapted from Hunt 2023.)
Current usage metrics show cumulative count of Article Views (full-text article views including HTML views, PDF and ePub downloads, according to the available data) and Abstracts Views on Vision4Press platform.
Data correspond to usage on the plateform after 2015. The current usage metrics is available 48-96 hours after online publication and is updated daily on week days.
Initial download of the metrics may take a while.