Fig. 2.
Download original image
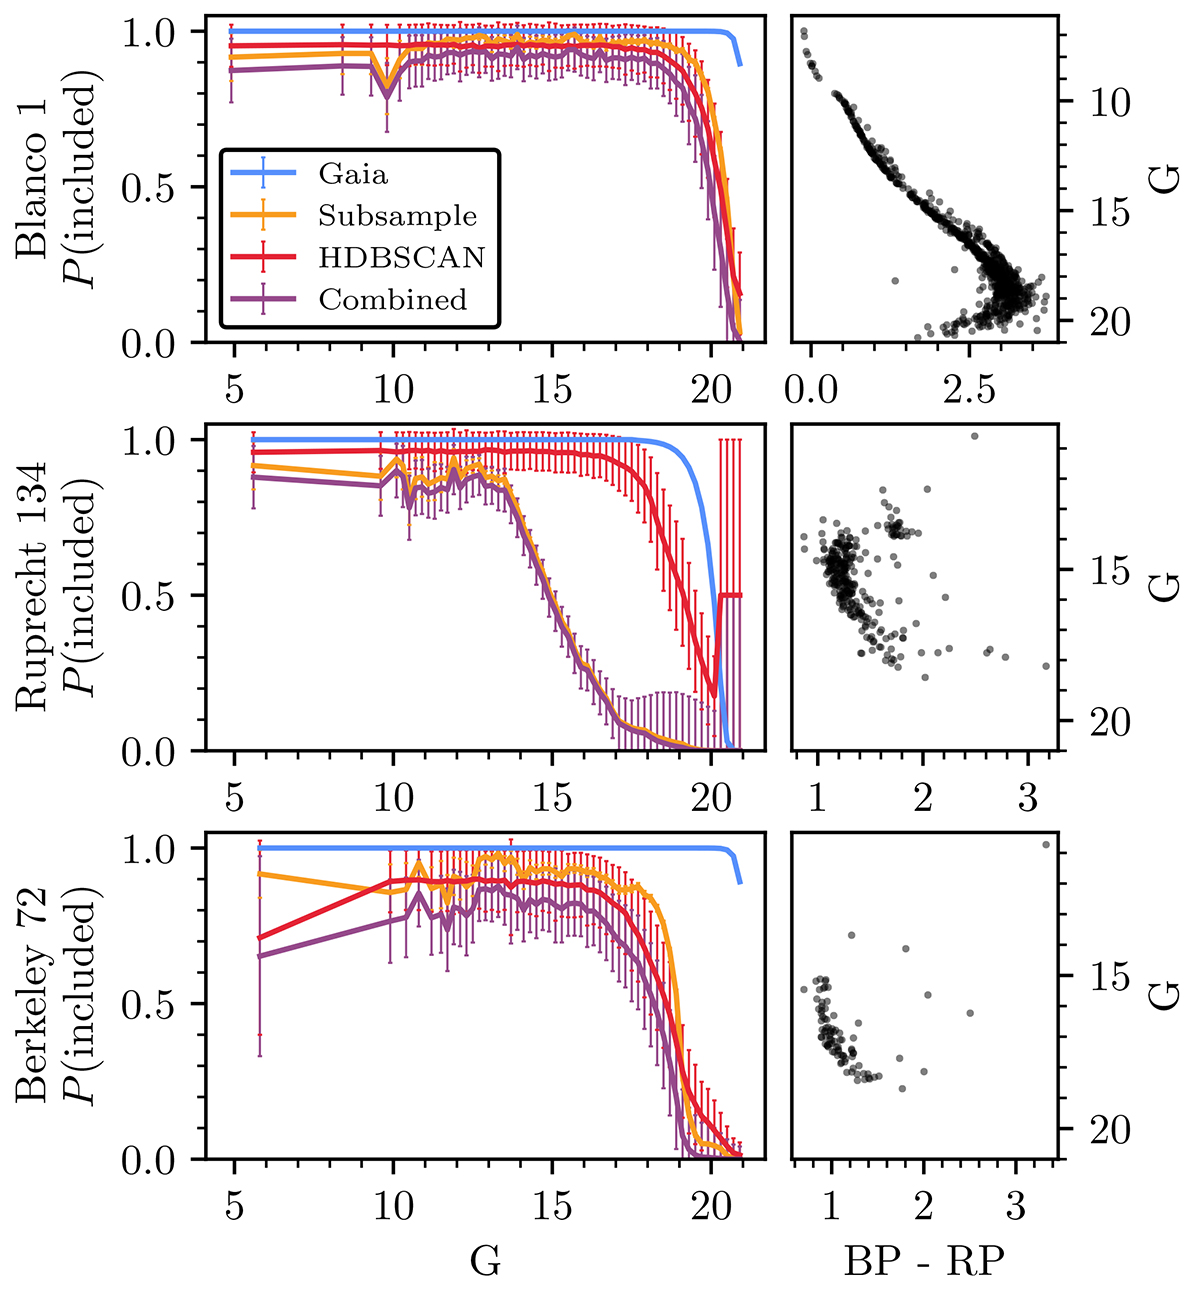
Computed cluster selection functions for Blanco 1 (top row), Ruprecht 134 (middle row), and Berkeley 72 (bottom row). The left panel in each row shows our adopted Gaia (blue), subsample (orange), and algorithm (HDBSCAN, red) selection functions as a function of magnitude for each cluster, in addition to the multiplicative total selection function (purple). The CMD of each cluster is shown for reference on the right panels. (Adapted from Hunt 2023.)
Current usage metrics show cumulative count of Article Views (full-text article views including HTML views, PDF and ePub downloads, according to the available data) and Abstracts Views on Vision4Press platform.
Data correspond to usage on the plateform after 2015. The current usage metrics is available 48-96 hours after online publication and is updated daily on week days.
Initial download of the metrics may take a while.