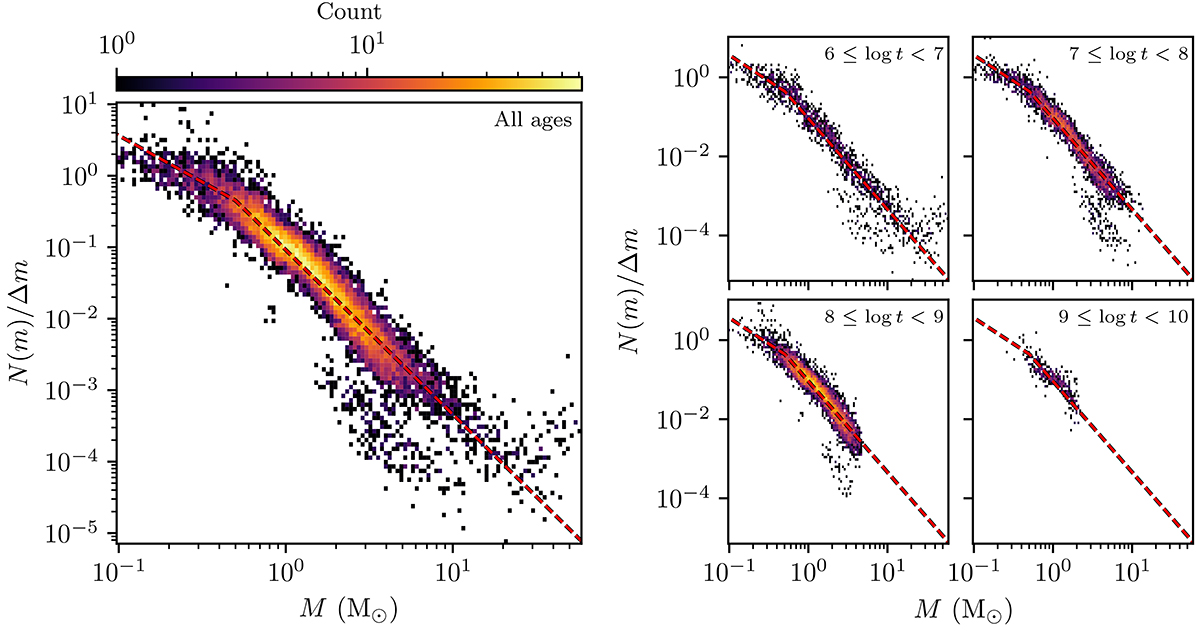
Fig. 18.
Download original image
Comparison between mass function points of clusters in this work and the Kroupa IMF. Left: 2D histograms of all points from all cluster mass functions in this work for 1235 OCs within 2 kpc in the high-quality sample of clusters and with at least 50 member stars compared against the Kroupa IMF (dashed red line). Individual cluster mass functions are normalised before combining. The colour of histogram bins denotes how many mass function points went into each individual bin, corresponding to the colour bar in the upper-right. Right: same as left panel, except clusters are divided into four separate age ranges.
Current usage metrics show cumulative count of Article Views (full-text article views including HTML views, PDF and ePub downloads, according to the available data) and Abstracts Views on Vision4Press platform.
Data correspond to usage on the plateform after 2015. The current usage metrics is available 48-96 hours after online publication and is updated daily on week days.
Initial download of the metrics may take a while.