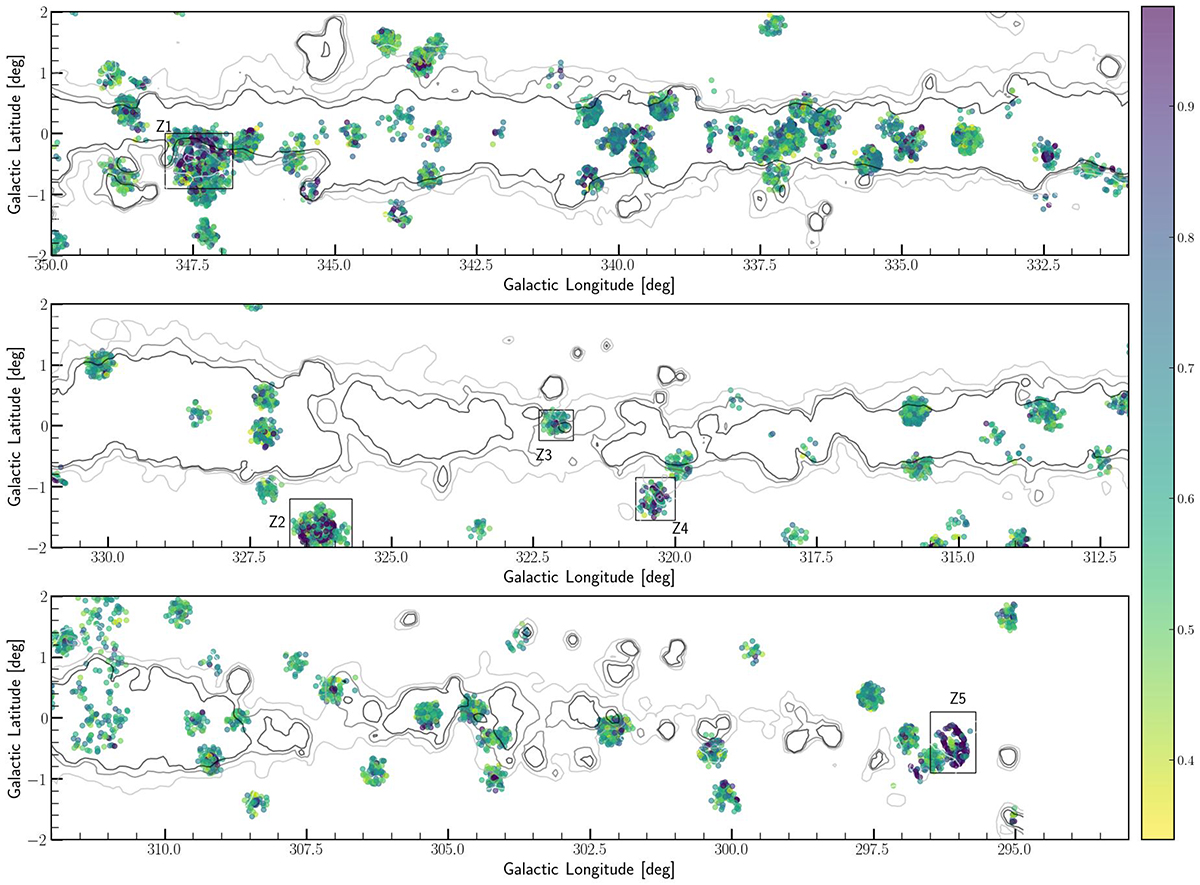
Fig. 5.
Download original image
Distribution of sources classified as galaxies in the southern Galactic disk of the VVV survey. The galaxies from Zhang et al. (2021) are color-coded according to their probability PX of being a galaxy. The black squares shows the “interesting zones” studied. The AV isocontours derived from the extinction maps of Schlafly & Finkbeiner (2011) are superimposed in gray scale with levels of 11, 15, 20, and 25 mag.
Current usage metrics show cumulative count of Article Views (full-text article views including HTML views, PDF and ePub downloads, according to the available data) and Abstracts Views on Vision4Press platform.
Data correspond to usage on the plateform after 2015. The current usage metrics is available 48-96 hours after online publication and is updated daily on week days.
Initial download of the metrics may take a while.