Open Access
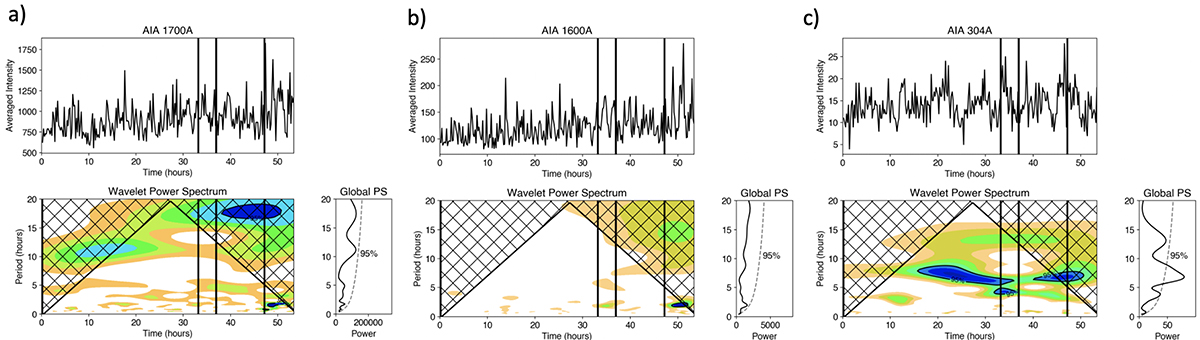
Fig. 4.
Download original image
Spatially averaged WPS of the intensity signals for the FoV the NOAA 12353 taken at (a) 1700 Å, (b) 1600 Å, and 304 Å. This figure is to be compared with the results presented in Fig. 3. We identified strong oscillation powers between 3.0−8.0 h for (c) 304 Å.
Current usage metrics show cumulative count of Article Views (full-text article views including HTML views, PDF and ePub downloads, according to the available data) and Abstracts Views on Vision4Press platform.
Data correspond to usage on the plateform after 2015. The current usage metrics is available 48-96 hours after online publication and is updated daily on week days.
Initial download of the metrics may take a while.