Fig. 3.
Download original image
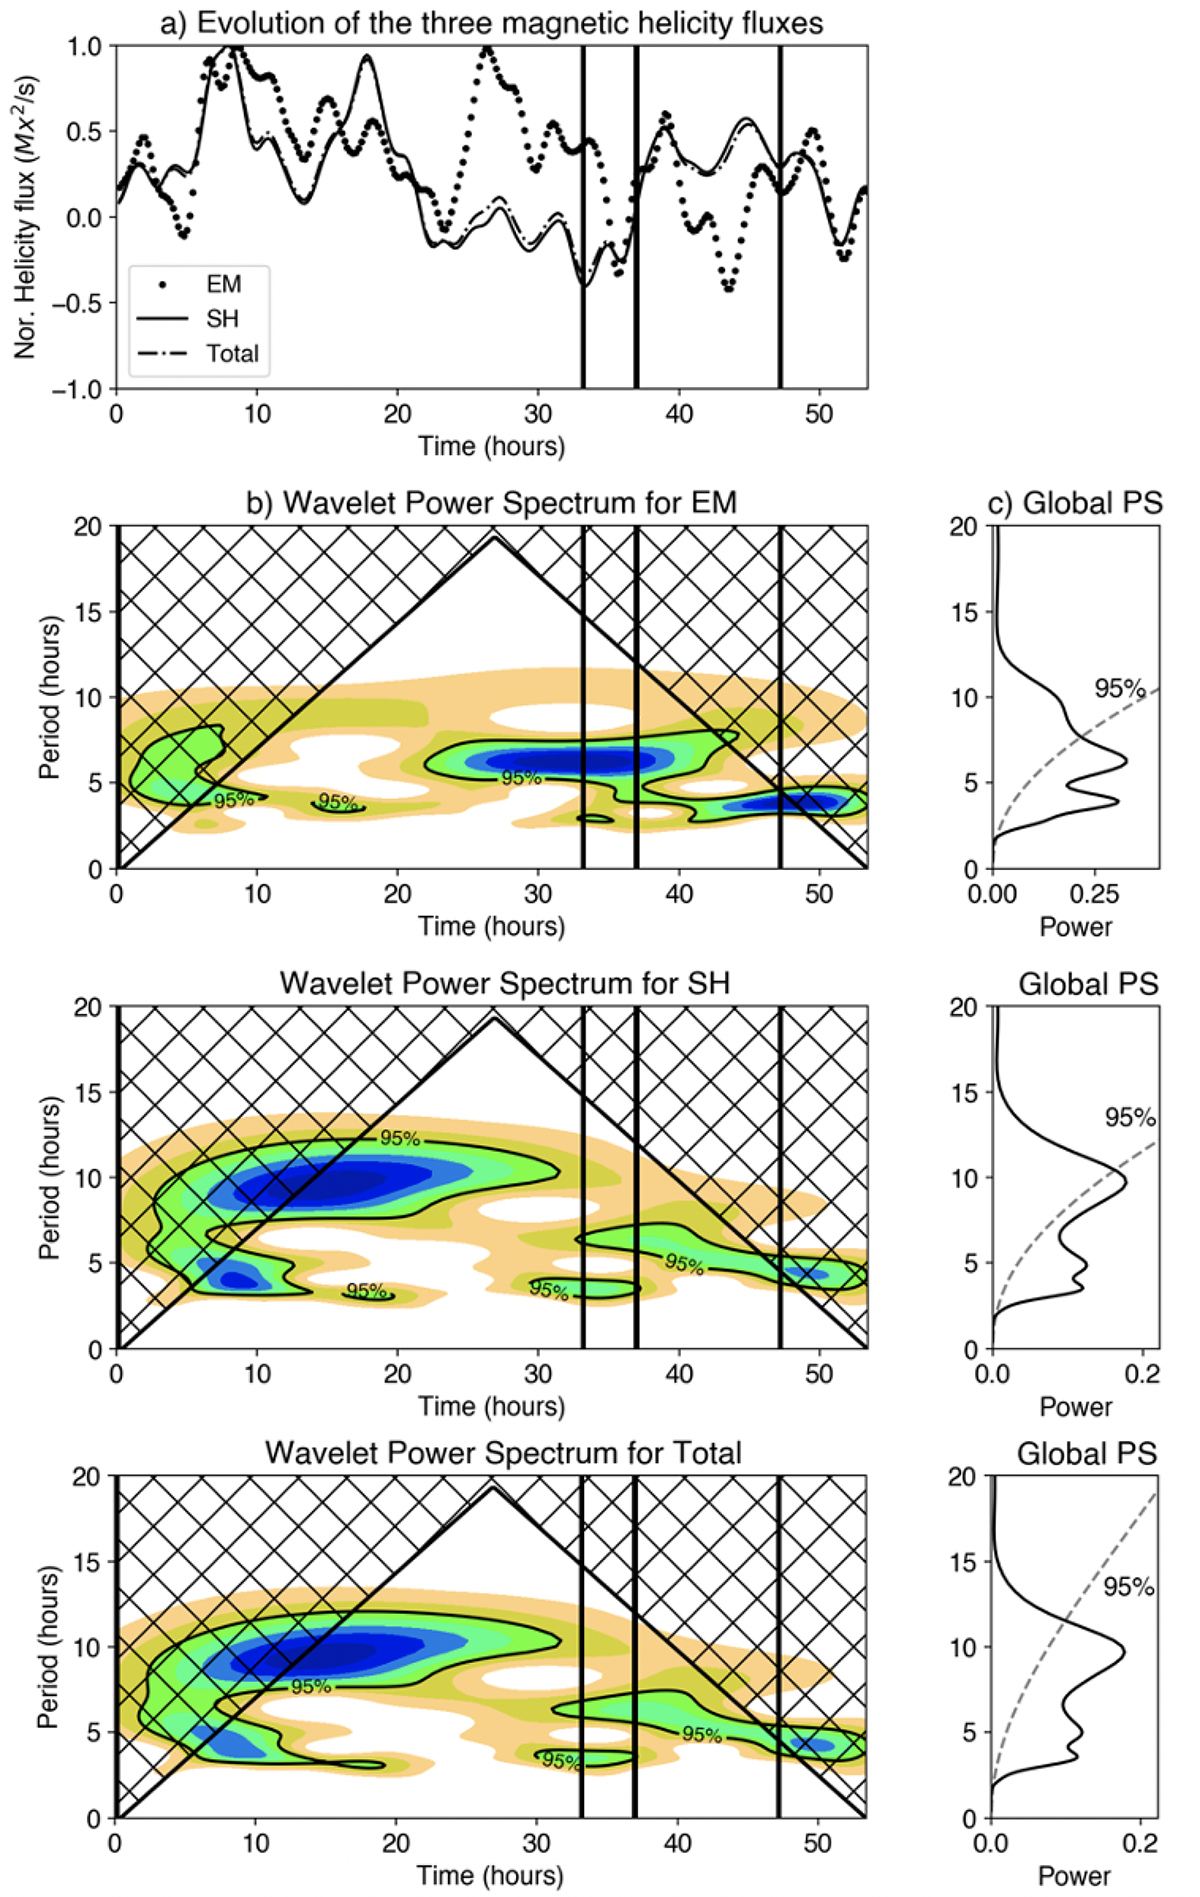
Temporal analysis of the magnetic helicity flux in the photosphere. The top panel a shows time series of the normalized emergence (EM, dotted line), shearing (SH, solid line), and Total (dash-dotted line) helicity fluxes. The vertical black lines mark the onset time of the C1.0 (03:30), C1.1 (07:30), and C2.3 (17:39) flares, respectively, on 2015 May 23. Rows 2–4 (panel b) show the wavelet power spectrum (WPS) of the EM, SH, and Total helicity fluxes. The x-axis of each WPS is the observation time, and the y-axis is the period, both in hours. The black lines in the WPS plots bound the cone of influence (hashed area), i.e., the domain in which edge effects may become important. The plots to the right of each WPS (panel c) are the corresponding global wavelet spectra (GPS) with power averaged over time. The dashed black lines mark the 2σ confidence for GPS analyses.
Current usage metrics show cumulative count of Article Views (full-text article views including HTML views, PDF and ePub downloads, according to the available data) and Abstracts Views on Vision4Press platform.
Data correspond to usage on the plateform after 2015. The current usage metrics is available 48-96 hours after online publication and is updated daily on week days.
Initial download of the metrics may take a while.