Fig. 2.
Download original image
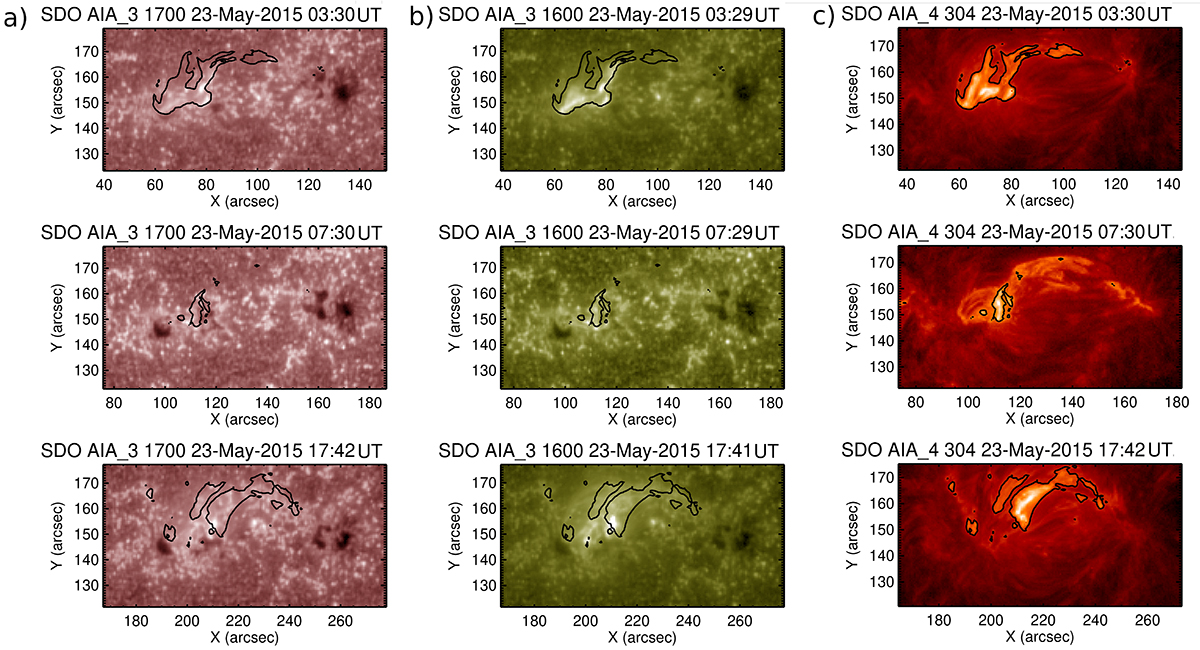
Series of AIA cutouts showing AR NOAA 12353 in panel a in the 1700 Å, in panel b in the 1600 Å, and in panel c in the 304 Å channels. Each row shows a snapshot of the region close to the onset times of C1.0, C1.1, and C2.3 flares. The selected areas have spatial dimensions of 108 × 54 arcsec2, and the axes indicate the position of the region with respect to the solar center. The overplotted black contours represent the largest intensity area during the corresponding flare event measured in the 304 Å wavelength.
Current usage metrics show cumulative count of Article Views (full-text article views including HTML views, PDF and ePub downloads, according to the available data) and Abstracts Views on Vision4Press platform.
Data correspond to usage on the plateform after 2015. The current usage metrics is available 48-96 hours after online publication and is updated daily on week days.
Initial download of the metrics may take a while.