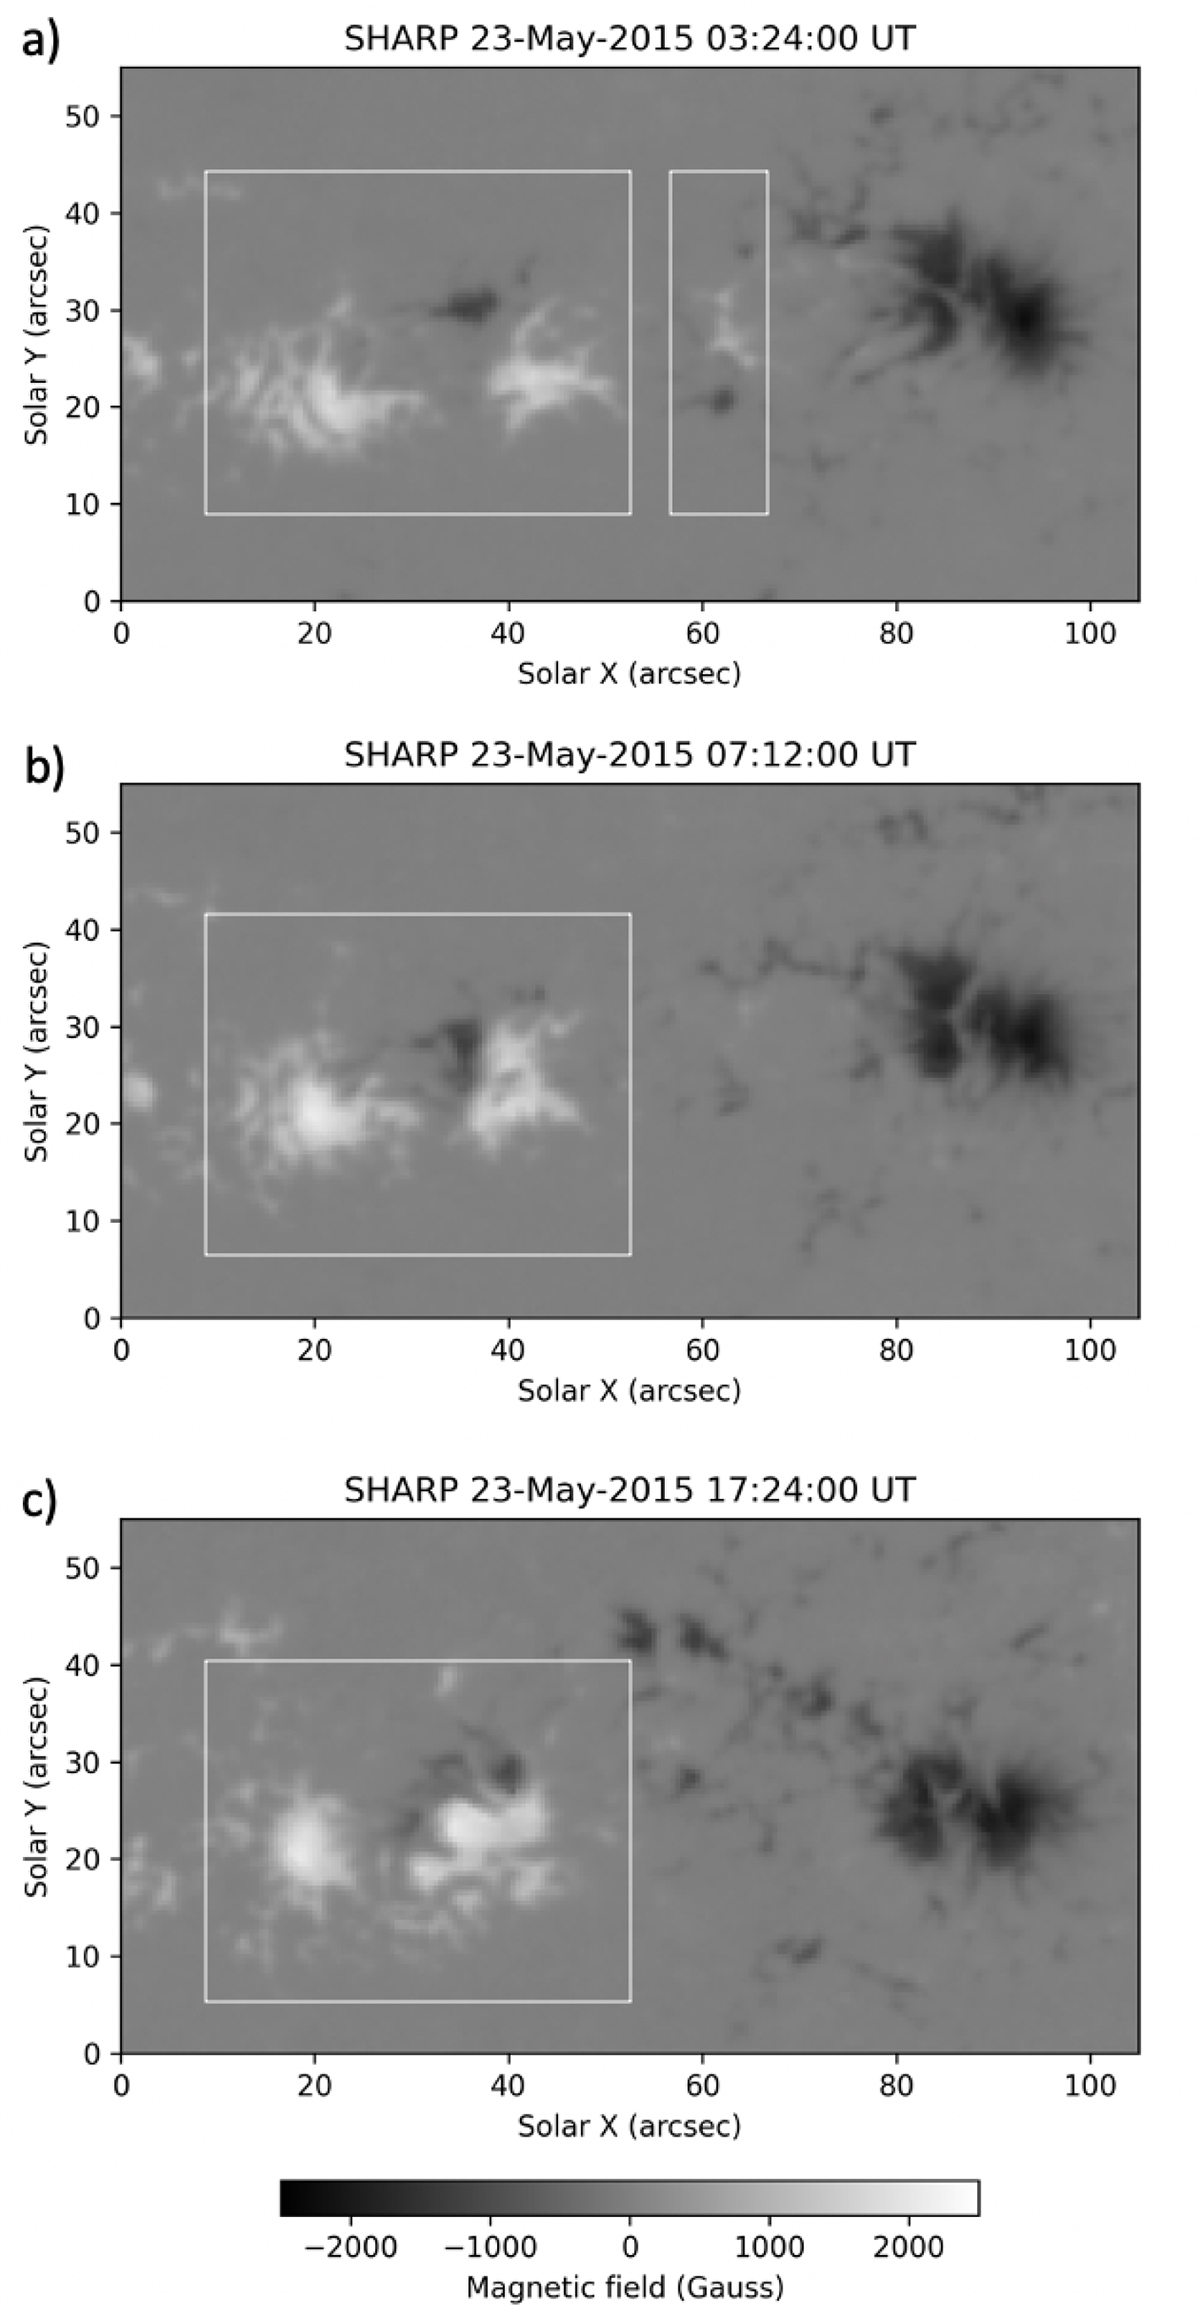
Fig. 1.
Download original image
AR NOAA 12353. The panels display the SHARP radial magnetic field component (Br). Panels a–c show the closest magnetogram in time to the X-ray flux peak of C1.0, C1.1, and C2.3, respectively, on 2015 May 23. The larger white square emphasizes the delta spot of the active region. The smaller white square in panel a marks the two close opposite polarities where the positive polarity disappeared after the C1.0 flare. The color bar gives information about the magnetic field strength.
Current usage metrics show cumulative count of Article Views (full-text article views including HTML views, PDF and ePub downloads, according to the available data) and Abstracts Views on Vision4Press platform.
Data correspond to usage on the plateform after 2015. The current usage metrics is available 48-96 hours after online publication and is updated daily on week days.
Initial download of the metrics may take a while.