Fig. 7
Download original image
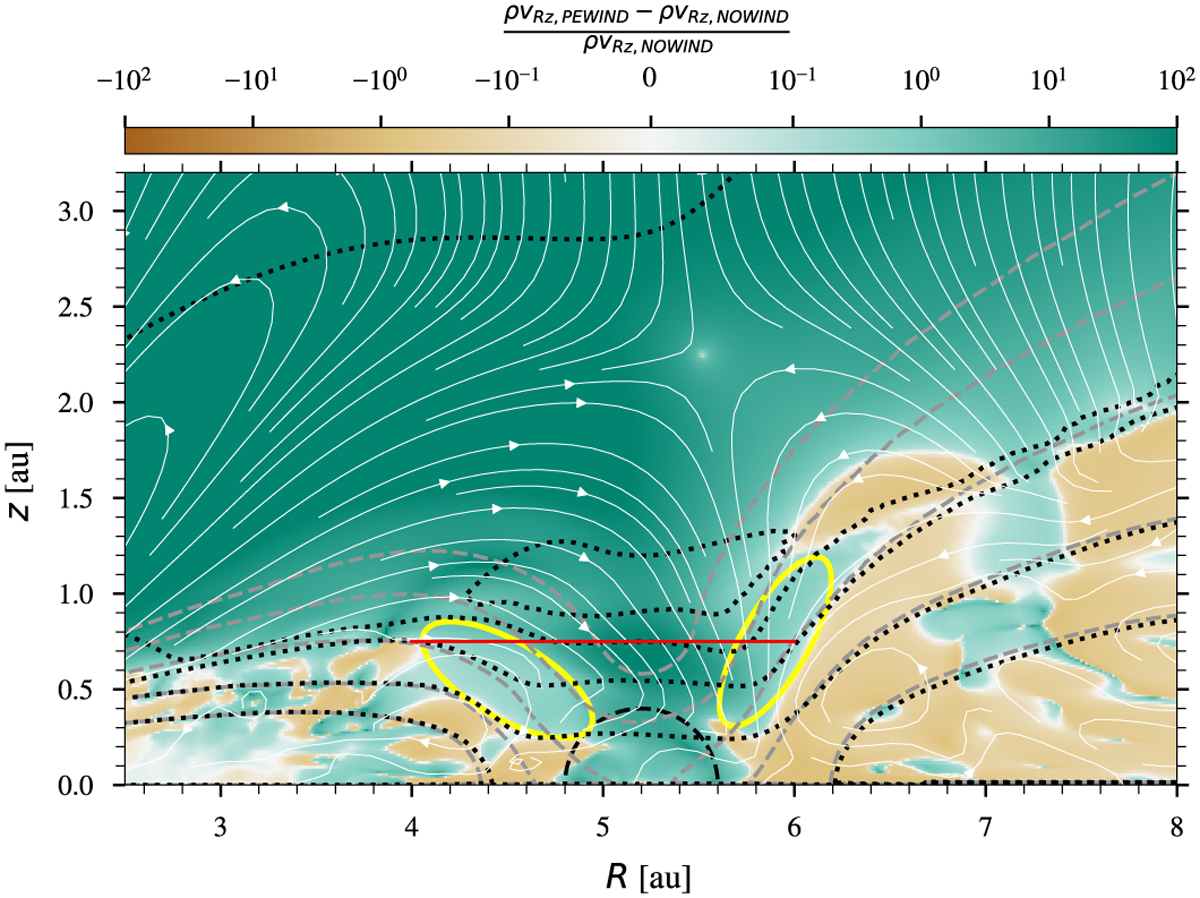
Relative difference of the azimuthally averaged mass flux magnitude in the meridional plane. The dotted black lines are density contours of the PEWIND model for (from top to bottom) 10−17 to 10−13 g cm−3 in increments of one order of magnitude. The dashed grey lines are the same contours for the NOWIND model. The red line defines the ring surface through which we calculate the vertical mass flux into the gap. The solid yellow ellipses highlight the gap edges with increased mass-flux in the PEWIND model. The dashed black circle shows the Hill sphere of the planet. The white solid lines are streamlines of the gas in the PEWIND model.
Current usage metrics show cumulative count of Article Views (full-text article views including HTML views, PDF and ePub downloads, according to the available data) and Abstracts Views on Vision4Press platform.
Data correspond to usage on the plateform after 2015. The current usage metrics is available 48-96 hours after online publication and is updated daily on week days.
Initial download of the metrics may take a while.